OPEN-SOURCE SCRIPT
Mis à jour Seasonality
This is my attempt to bring an open source Seasonality indicator to TradingView.
There are still outstanding issues I couldn't figure out, so I am hoping some more seasoned Pine Script coders can take the lead from here.
What is Seasonality: https://www.investopedia.com/terms/s/seasonality.asp
How to Use
Known Issues
Areas for Improvement
There are still outstanding issues I couldn't figure out, so I am hoping some more seasoned Pine Script coders can take the lead from here.
What is Seasonality: https://www.investopedia.com/terms/s/seasonality.asp
How to Use
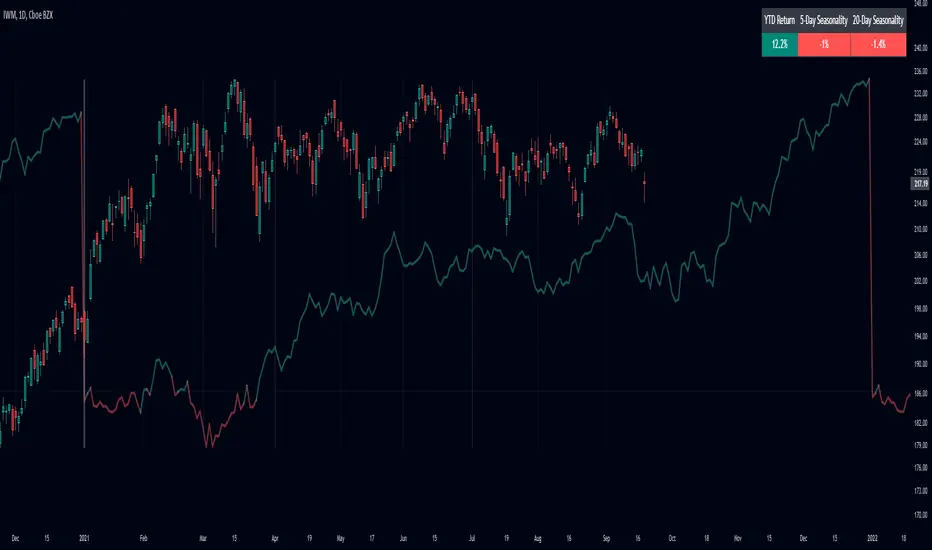
- The indicator plots the avg % change per bar for all complete years, up to 20 years back.
- It will only show in the daily resolution.
- For charts with more data, you need to scroll back a bit to get the line to display.
- Use Offset Adjust in the menu for charts that do not align perfectly to the start of the year.
- Use Smoothing in the menu to apply an EMA to the line.
- The panel shows YTD % gain, 5-day rolling seasonality, and 20-day rolling seasonality.
Known Issues
- Does not work for tickers with over 10,000 bars of data.
- Some tickers do not align correctly.
- Only works with tickers that have ~252 bars a year.
Areas for Improvement
- Figure out a way to use barssince() to get the precise amount of bars for each year. This will make the seasonality calculation and automatic offset more accurate.
- Have an option for calendar week, month, and year seasonality.
Notes de version
Cleaned up the script.Notes de version
Cleaned up the code some more so it is easier to read.Script open-source
Dans l'esprit TradingView, le créateur de ce script l'a rendu open source afin que les traders puissent examiner et vérifier ses fonctionnalités. Bravo à l'auteur! Bien que vous puissiez l'utiliser gratuitement, n'oubliez pas que la republication du code est soumise à nos Règles.
Clause de non-responsabilité
Les informations et publications ne sont pas destinées à être, et ne constituent pas, des conseils ou recommandations financiers, d'investissement, de trading ou autres fournis ou approuvés par TradingView. Pour en savoir plus, consultez les Conditions d'utilisation.
Script open-source
Dans l'esprit TradingView, le créateur de ce script l'a rendu open source afin que les traders puissent examiner et vérifier ses fonctionnalités. Bravo à l'auteur! Bien que vous puissiez l'utiliser gratuitement, n'oubliez pas que la republication du code est soumise à nos Règles.
Clause de non-responsabilité
Les informations et publications ne sont pas destinées à être, et ne constituent pas, des conseils ou recommandations financiers, d'investissement, de trading ou autres fournis ou approuvés par TradingView. Pour en savoir plus, consultez les Conditions d'utilisation.