PROTECTED SOURCE SCRIPT
W%R & Stoch - MTF Table
✅ คำอธิบายภาษาไทย (Thai Description)
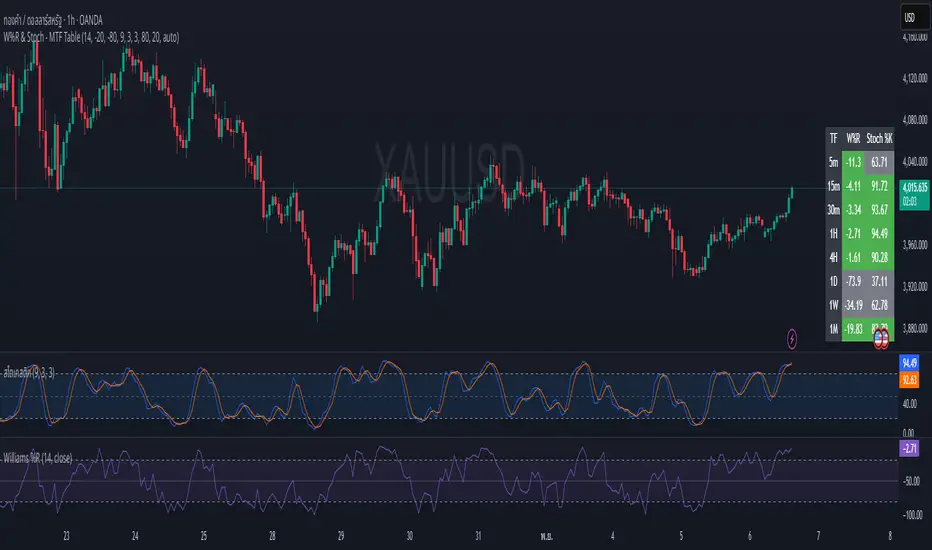
Williams %R & Stochastic (9,3,3) Multi-Timeframe Table
อินดิเคเตอร์นี้ออกแบบมาเพื่อช่วยเทรดเดอร์มองเห็นภาวะ Overbought / Oversold ของราคาใน หลายกรอบเวลา โดยแสดงผลเป็น ตารางมุมขวาล่าง เพื่อให้สามารถประเมินโมเมนตัมของตลาดได้อย่างรวดเร็วโดยไม่ต้องเปลี่ยน Timeframe ไปมา
🔍 Timeframes ที่แสดง
5m • 15m • 30m • 1H • 4H • 1D • 1W • 1M
📊 ค่าที่ใช้ประเมิน
Williams %R (W%R) → วัดตำแหน่งราคาปัจจุบันเทียบกับ High/Low ย้อนหลัง
Stochastic %K (9,3,3) → วัดโมเมนตัมและแรงเหวี่ยงของราคา
🎨 การลงสี (ตีความได้ทันที)
สถานะ เงื่อนไข สี
Overbought ค่า ≥ เกณฑ์ OB 🟩 เขียว
Oversold ค่า ≤ เกณฑ์ OS 🟥 แดง
ปกติ / กลางๆ อยู่ระหว่าง OB และ OS ⚪ เทา
🎯 วิธีนำไปใช้งาน
ถ้า หลาย TF เป็น Oversold (สีแดง) → มีโอกาสเกิด แรงดีดกลับขึ้น
ถ้า หลาย TF เป็น Overbought (สีเขียว) → มีโอกาสเกิด แรงกดลงของราคา
ถ้า TF ใหญ่ Oversold แต่ TF เล็กเริ่มกลับตัวขึ้น → เป็นจังหวะเข้าที่มีคุณภาพสูง
แนะนำให้ใช้ร่วมกับโครงสร้างราคา แนวรับ-แนวต้าน หรือ Volume เพื่อความแม่นยำที่มากขึ้น
=========================================================================
✅ English Description
Williams %R & Stochastic (9,3,3) Multi-Timeframe Table
This indicator provides a clear visual overview of momentum and market pressure across multiple timeframes by displaying a compact table in the bottom-right corner of the chart. It allows traders to quickly assess overbought/oversold conditions without switching timeframes.
🔍 Timeframes Displayed
5m • 15m • 30m • 1H • 4H • 1D • 1W • 1M
📊 Metrics Used
Williams %R (W%R) — measures price position relative to recent highs and lows
Stochastic %K (9,3,3) — measures momentum based on recent price swings
🎨 Color Coding (Quick Interpretation)
Status Condition Color
Overbought Value ≥ OB threshold 🟩 Green
Oversold Value ≤ OS threshold 🟥 Red
Neutral Between OB and OS ⚪ Gray
🎯 How to Use It
Multiple timeframes Oversold (Red) → Possible bullish reversal setup
Multiple timeframes Overbought (Green) → Possible bearish reversal setup
If higher timeframe is Oversold but lower timeframe begins to turn upward → high-quality entry timing
This indicator is not a standalone buy/sell signal.
Best used with market structure, support/resistance, and volume context.
Williams %R & Stochastic (9,3,3) Multi-Timeframe Table
อินดิเคเตอร์นี้ออกแบบมาเพื่อช่วยเทรดเดอร์มองเห็นภาวะ Overbought / Oversold ของราคาใน หลายกรอบเวลา โดยแสดงผลเป็น ตารางมุมขวาล่าง เพื่อให้สามารถประเมินโมเมนตัมของตลาดได้อย่างรวดเร็วโดยไม่ต้องเปลี่ยน Timeframe ไปมา
🔍 Timeframes ที่แสดง
5m • 15m • 30m • 1H • 4H • 1D • 1W • 1M
📊 ค่าที่ใช้ประเมิน
Williams %R (W%R) → วัดตำแหน่งราคาปัจจุบันเทียบกับ High/Low ย้อนหลัง
Stochastic %K (9,3,3) → วัดโมเมนตัมและแรงเหวี่ยงของราคา
🎨 การลงสี (ตีความได้ทันที)
สถานะ เงื่อนไข สี
Overbought ค่า ≥ เกณฑ์ OB 🟩 เขียว
Oversold ค่า ≤ เกณฑ์ OS 🟥 แดง
ปกติ / กลางๆ อยู่ระหว่าง OB และ OS ⚪ เทา
🎯 วิธีนำไปใช้งาน
ถ้า หลาย TF เป็น Oversold (สีแดง) → มีโอกาสเกิด แรงดีดกลับขึ้น
ถ้า หลาย TF เป็น Overbought (สีเขียว) → มีโอกาสเกิด แรงกดลงของราคา
ถ้า TF ใหญ่ Oversold แต่ TF เล็กเริ่มกลับตัวขึ้น → เป็นจังหวะเข้าที่มีคุณภาพสูง
แนะนำให้ใช้ร่วมกับโครงสร้างราคา แนวรับ-แนวต้าน หรือ Volume เพื่อความแม่นยำที่มากขึ้น
=========================================================================
✅ English Description
Williams %R & Stochastic (9,3,3) Multi-Timeframe Table
This indicator provides a clear visual overview of momentum and market pressure across multiple timeframes by displaying a compact table in the bottom-right corner of the chart. It allows traders to quickly assess overbought/oversold conditions without switching timeframes.
🔍 Timeframes Displayed
5m • 15m • 30m • 1H • 4H • 1D • 1W • 1M
📊 Metrics Used
Williams %R (W%R) — measures price position relative to recent highs and lows
Stochastic %K (9,3,3) — measures momentum based on recent price swings
🎨 Color Coding (Quick Interpretation)
Status Condition Color
Overbought Value ≥ OB threshold 🟩 Green
Oversold Value ≤ OS threshold 🟥 Red
Neutral Between OB and OS ⚪ Gray
🎯 How to Use It
Multiple timeframes Oversold (Red) → Possible bullish reversal setup
Multiple timeframes Overbought (Green) → Possible bearish reversal setup
If higher timeframe is Oversold but lower timeframe begins to turn upward → high-quality entry timing
This indicator is not a standalone buy/sell signal.
Best used with market structure, support/resistance, and volume context.
Script protégé
Ce script est publié en source fermée. Toutefois, vous pouvez l'utiliser librement et sans aucune restriction - en savoir plus ici.
Clause de non-responsabilité
Les informations et les publications ne sont pas destinées à être, et ne constituent pas, des conseils ou des recommandations en matière de finance, d'investissement, de trading ou d'autres types de conseils fournis ou approuvés par TradingView. Pour en savoir plus, consultez les Conditions d'utilisation.