OPEN-SOURCE SCRIPT
Mis à jour SMA Direction Cross Currency Summary
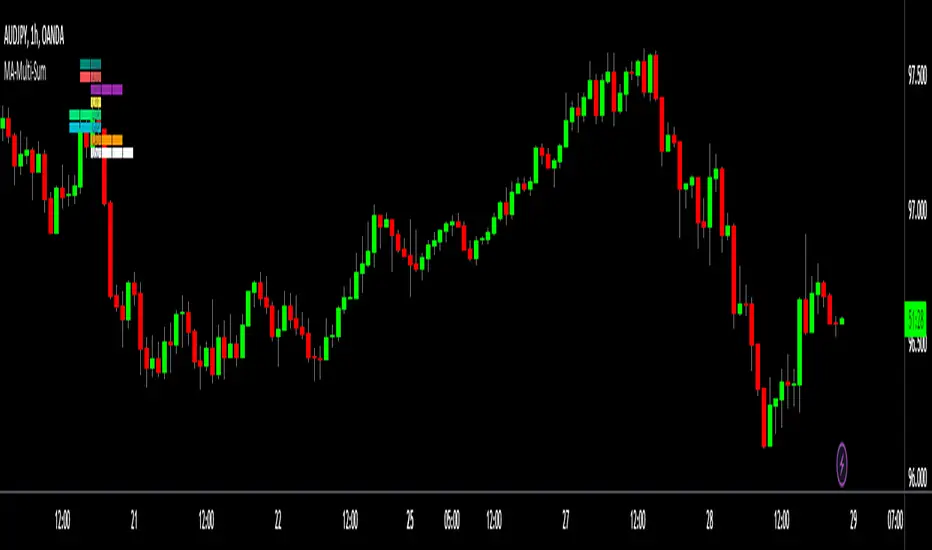
This script shows the average SMA direction of each of the majors and crosses when compared to each other. The more blocks to the right the stronger the currency on that timeframe. The more blocks to the left the weaker the currency.
I'm finding it useful to quickly know the average flow of movement for each currency on the higher timeframes and then focus on that for a daily trade. I also like how i dont have to keep jumping between instruments to stay upto date. I'm not a 'real' trader so I have very limited time and attention for this so this does the job as a crude replacement for trawling all the chart each day.

The currencies compared are:
-NZD
-AUD
-JPY
-CHF
-EUR
-GBP
-CAD
-USD
The way it is calculated is that its based on the 20 SMA. For each currency vs the other crosses:
if the SMA is pointing up and price is higher = +2
if the SMA is pointing up and price is lower = +1
if the SMA is pointing down and price is higher = -2
if the SMA is pointing down and price is lower = -1
So if we where considering GBP. We would do that for GBPNZD, GBPAUD, GBPPJY, GBPCHF, GBPEUR, GBPCAD, GBPUSD. We would then consider this sum against all the currencies to understand the relative strength.
Due to the limit on how many instruments can be called in a single indicated you need to load it for each currencies so 8 currencies = 8 indicators.
Its a bit of a frankinstien script - it just throw it togeather so its probably got redundant code etc. Its built around 20 SMA - no idea what would happens when you change that.
I'm finding it useful to quickly know the average flow of movement for each currency on the higher timeframes and then focus on that for a daily trade. I also like how i dont have to keep jumping between instruments to stay upto date. I'm not a 'real' trader so I have very limited time and attention for this so this does the job as a crude replacement for trawling all the chart each day.
The currencies compared are:
-NZD
-AUD
-JPY
-CHF
-EUR
-GBP
-CAD
-USD
The way it is calculated is that its based on the 20 SMA. For each currency vs the other crosses:
if the SMA is pointing up and price is higher = +2
if the SMA is pointing up and price is lower = +1
if the SMA is pointing down and price is higher = -2
if the SMA is pointing down and price is lower = -1
So if we where considering GBP. We would do that for GBPNZD, GBPAUD, GBPPJY, GBPCHF, GBPEUR, GBPCAD, GBPUSD. We would then consider this sum against all the currencies to understand the relative strength.
Due to the limit on how many instruments can be called in a single indicated you need to load it for each currencies so 8 currencies = 8 indicators.
Its a bit of a frankinstien script - it just throw it togeather so its probably got redundant code etc. Its built around 20 SMA - no idea what would happens when you change that.
Notes de version
Now you can cover 4 currencies with 1 indicator. (2 instances will cover all 8 majors and crosses)Notes de version
Now loads all currencies in 1 indicatorNotes de version
fixing problemScript open-source
Dans l'esprit TradingView, le créateur de ce script l'a rendu open source afin que les traders puissent examiner et vérifier ses fonctionnalités. Bravo à l'auteur! Bien que vous puissiez l'utiliser gratuitement, n'oubliez pas que la republication du code est soumise à nos Règles.
Clause de non-responsabilité
Les informations et publications ne sont pas destinées à être, et ne constituent pas, des conseils ou recommandations financiers, d'investissement, de trading ou autres fournis ou approuvés par TradingView. Pour en savoir plus, consultez les Conditions d'utilisation.
Script open-source
Dans l'esprit TradingView, le créateur de ce script l'a rendu open source afin que les traders puissent examiner et vérifier ses fonctionnalités. Bravo à l'auteur! Bien que vous puissiez l'utiliser gratuitement, n'oubliez pas que la republication du code est soumise à nos Règles.
Clause de non-responsabilité
Les informations et publications ne sont pas destinées à être, et ne constituent pas, des conseils ou recommandations financiers, d'investissement, de trading ou autres fournis ou approuvés par TradingView. Pour en savoir plus, consultez les Conditions d'utilisation.