OPEN-SOURCE SCRIPT
Ehlers Universal Oscillator [LazyBear]
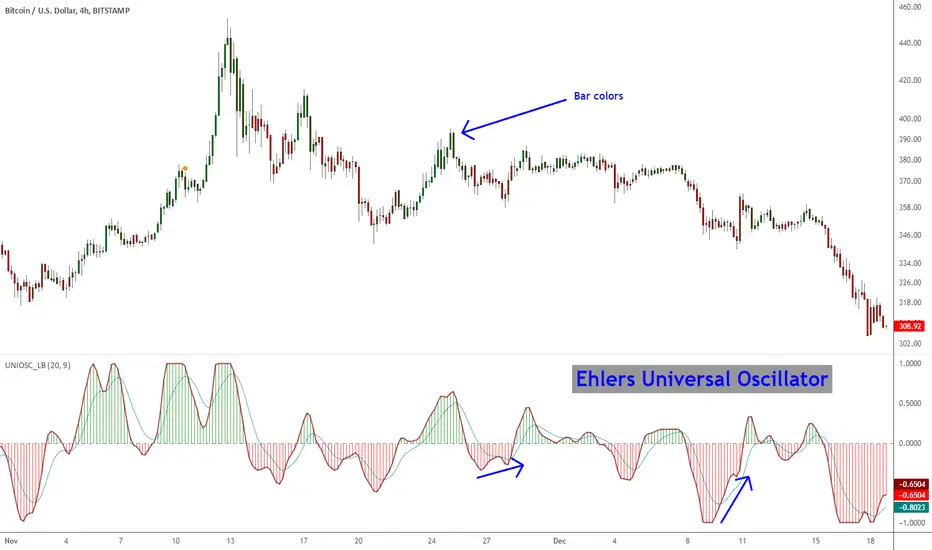
Universal Oscillator by Mr. Ehlers is an evolution of his SuperSmoother filter. The new indicator follows the swings in price without introducing extra delay.
It is controlled through one single input – the band edge – which basically is frequency. The smaller it is set, the less lag there is, but you may see lot of whipsaws. Built-in automatic gain control normalizes the output to vary between the range of -1 to +1.
Mr. Ehlers suggests a straightforward system:
- Buy when long-term Universal Oscillator crosses above zero
- Sell when long-term Universal Oscillator crosses below zero
I have added options to draw a signal line, histogram and bar coloring. Bar coloring, if enabled, is done using the histogram color, but you can change it easily to signal_cross by uncommenting a line (check the source).
More info:
[S&C 2015/01] Whiter is Brighter - Ehlers
List of my other indicators:
- GDoc: docs.google.com/document/d/15AGCufJZ8CIUvwFJ9W-IKns88gkWOKBCvByMEvm5MLo/edit?usp=sharing
- Chart: tradingview.com/v/4IneGo8h/
Script open-source
Dans l'esprit TradingView, le créateur de ce script l'a rendu open source afin que les traders puissent examiner et vérifier ses fonctionnalités. Bravo à l'auteur! Bien que vous puissiez l'utiliser gratuitement, n'oubliez pas que la republication du code est soumise à nos Règles.
List of my free indicators: bit.ly/1LQaPK8
List of my indicators at Appstore: blog.tradingview.com/?p=970
List of my indicators at Appstore: blog.tradingview.com/?p=970
Clause de non-responsabilité
Les informations et publications ne sont pas destinées à être, et ne constituent pas, des conseils ou recommandations financiers, d'investissement, de trading ou autres fournis ou approuvés par TradingView. Pour en savoir plus, consultez les Conditions d'utilisation.