PROTECTED SOURCE SCRIPT
Mis à jour PVA Volume - DataCrypto Analytics
The PVA Volume indicator (Price Volume Analysis) is a technical indicator that transforms the accumulated historical data.
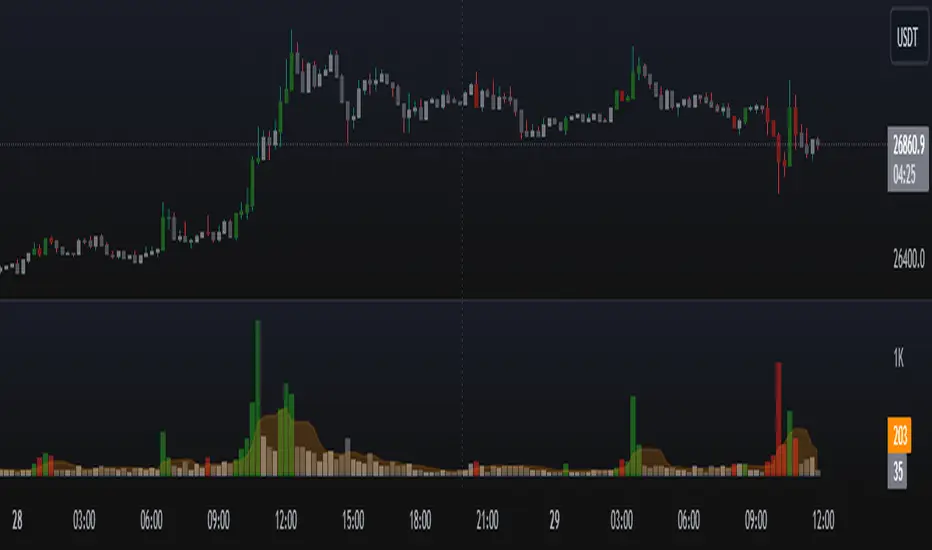
The PVA Volume Indicator displays a color-coded volume histogram based on Price Volume Analysis (PVA). It is plotted on a separate panel below the price chart of the underlying asset and colors the candles according to the PVA. The indicator represents four market states by means of four different colored histogram bars:
Green : Extreme volume on a bullish candle
Red : Extreme volume on a bearish candle
Silver : Neutral Volume, increasing more than the average
Gray : Neutral Volume
The PVA Volume indicator can be applied to confirm the action of the high or low price of any financial instrument.
Notes de version
- Update to version 5- Code organization
Script protégé
Ce script est publié en source fermée. Cependant, vous pouvez l'utiliser librement et sans aucune restriction – pour en savoir plus, cliquez ici.
Clause de non-responsabilité
Les informations et publications ne sont pas destinées à être, et ne constituent pas, des conseils ou recommandations financiers, d'investissement, de trading ou autres fournis ou approuvés par TradingView. Pour en savoir plus, consultez les Conditions d'utilisation.