OPEN-SOURCE SCRIPT
Kumo Implied Volatility
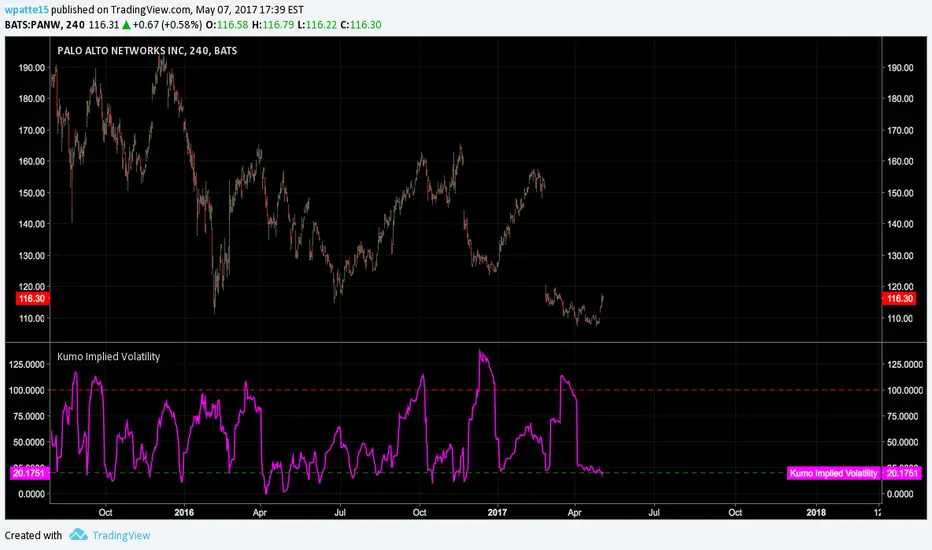
From ProRealCode prorealcode.com/prorealtime-indicators/kumo-implied-volatility/:
"In my pursuit to quantify the Ichimoku indicator, I have tried to quantify implied volatility by measuring the Kumo thickness. Firstly, I took the absolute value of the distance between SpanA and SpanB, I then normalized the value and created standard deviation bands. Now I can compare the Kumo thickness with the average thickness over 200 periods. When the value goes above 100, it implies that the Kumo is thicker than 2 standard deviations of the average (there is therefore only a 5% chance that this happens). A reading over 100 might indicate trend exhaustion and a reading below 20 indicates low volatility and Kumo twists (I chose 20 only by observation and not statistical significance). Interestingly, this indicator sometime gives similar information to ADX. So far, the best use for this indicator is as a setup indicator for trend exhaustion or low volatility breakouts from Kumo twists. Extreme readings before Kumo breakouts looks interesting."
"In my pursuit to quantify the Ichimoku indicator, I have tried to quantify implied volatility by measuring the Kumo thickness. Firstly, I took the absolute value of the distance between SpanA and SpanB, I then normalized the value and created standard deviation bands. Now I can compare the Kumo thickness with the average thickness over 200 periods. When the value goes above 100, it implies that the Kumo is thicker than 2 standard deviations of the average (there is therefore only a 5% chance that this happens). A reading over 100 might indicate trend exhaustion and a reading below 20 indicates low volatility and Kumo twists (I chose 20 only by observation and not statistical significance). Interestingly, this indicator sometime gives similar information to ADX. So far, the best use for this indicator is as a setup indicator for trend exhaustion or low volatility breakouts from Kumo twists. Extreme readings before Kumo breakouts looks interesting."
Script open-source
Dans l'esprit TradingView, le créateur de ce script l'a rendu open source afin que les traders puissent examiner et vérifier ses fonctionnalités. Bravo à l'auteur! Bien que vous puissiez l'utiliser gratuitement, n'oubliez pas que la republication du code est soumise à nos Règles.
Clause de non-responsabilité
Les informations et publications ne sont pas destinées à être, et ne constituent pas, des conseils ou recommandations financiers, d'investissement, de trading ou autres fournis ou approuvés par TradingView. Pour en savoir plus, consultez les Conditions d'utilisation.