OPEN-SOURCE SCRIPT
Mis à jour ka66: Candle Range Indicator
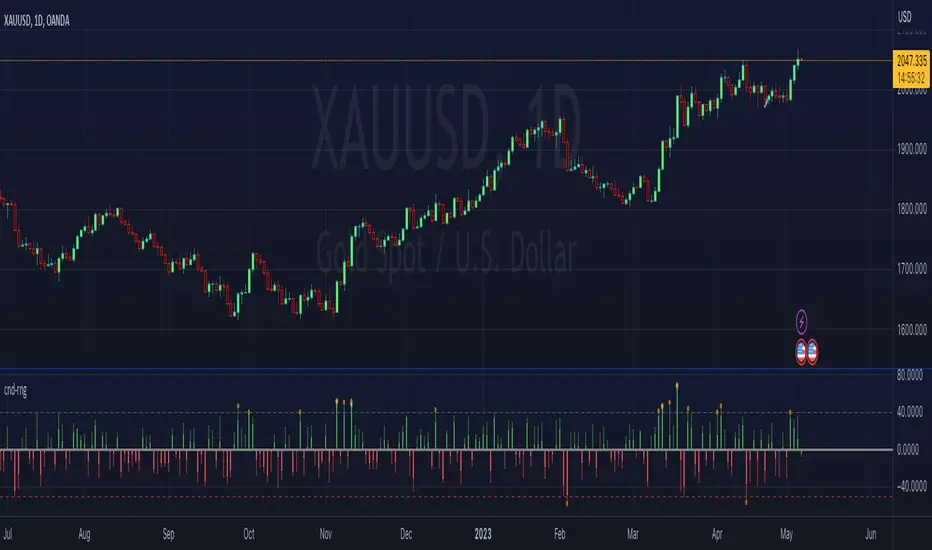
Visually shows the Body Range (open to close) and Candle Range (high to low).
Semi-transparent overlapping area is the full Candle Range, and fully-opaque smaller area is the Body Range. For aesthetics and visual consistency, Candle Range follows the direction of the Body Range, even though technically it's always positive (high - low).
The different plots for each range type also means the UI will allow deselecting one or the other as needed. For example, some strategies may care only about the Body Range, rather than the entire Candle Range, so the latter can be hidden to reduce noise.
Threshold horizontal lines are plotted, so the trader can modify these high and low levels as needed through the user interface. These need to be configured to match the instrument's price range levels for the timeframe. The defaults are pretty arbitrary for +/- 0.0080 (80 pips in a 4-decimal place forex pair). Where a range reaches or exceeds a threshold, it's visually marked as well with a shape at the Body or Candle peak, to assist with quicker visual potential setup scanning, for example, to anticipate a following reversal or continuation.
Notes de version
Bug fix: Actually allow configuring the positive and negative thresholds via User Inputs!Notes de version
Allow option (default is false) to show histogram in positive/absolute scale, based on user request, while maintaining correct threshold checks.Script open-source
Dans l'esprit TradingView, le créateur de ce script l'a rendu open source afin que les traders puissent examiner et vérifier ses fonctionnalités. Bravo à l'auteur! Bien que vous puissiez l'utiliser gratuitement, n'oubliez pas que la republication du code est soumise à nos Règles.
Clause de non-responsabilité
Les informations et publications ne sont pas destinées à être, et ne constituent pas, des conseils ou recommandations financiers, d'investissement, de trading ou autres fournis ou approuvés par TradingView. Pour en savoir plus, consultez les Conditions d'utilisation.
Script open-source
Dans l'esprit TradingView, le créateur de ce script l'a rendu open source afin que les traders puissent examiner et vérifier ses fonctionnalités. Bravo à l'auteur! Bien que vous puissiez l'utiliser gratuitement, n'oubliez pas que la republication du code est soumise à nos Règles.
Clause de non-responsabilité
Les informations et publications ne sont pas destinées à être, et ne constituent pas, des conseils ou recommandations financiers, d'investissement, de trading ou autres fournis ou approuvés par TradingView. Pour en savoir plus, consultez les Conditions d'utilisation.