OPEN-SOURCE SCRIPT
KLNI RSI MTF
Description of the RSI Multi-Timeframe Indicator
The RSI Multi-Timeframe Indicator allows you to track and compare the Relative Strength Index (RSI) across three different timeframes on the same chart. This is particularly useful for traders who want to gauge the momentum of an asset over multiple time periods simultaneously, helping to make more informed trading decisions.
Key Features
Multi-Timeframe RSI:
You can select up to three timeframes to plot RSI on the same chart.
Available timeframe options include:
Current: Displays RSI for the current chart timeframe.
60 minutes (1 hour)
Daily
Weekly
Monthly
Custom RSI Settings:
Adjust the RSI length and source (e.g., close price) through user inputs, allowing you to tailor the indicator to your strategy.
Divergence Detection (Optional):
The indicator can optionally detect and display bullish and bearish divergences between price and RSI for the first selected timeframe.
Bullish divergence is shown when price makes a lower low, but RSI makes a higher low.
Bearish divergence is shown when price makes a higher high, but RSI makes a lower high.
Visual Aids:
Overbought and oversold RSI levels are highlighted with background colors for clarity.
Horizontal lines at 70 (overbought), 50 (neutral), and 30 (oversold) help quickly identify RSI conditions.
How to Use This Indicator
Inputs & Settings
Timeframe Settings:
First Timeframe: Choose the primary timeframe (e.g., 60 minutes, Daily, Weekly).
Second Timeframe: Select the second timeframe to plot on the chart.
Third Timeframe: Select the third timeframe for additional RSI analysis.
RSI Settings:
RSI Length: Set the period for RSI calculation (default: 14).
Source: Select the price data for RSI calculation (default: close price).
Show Divergence: Enable or disable the detection of divergence between price and RSI.
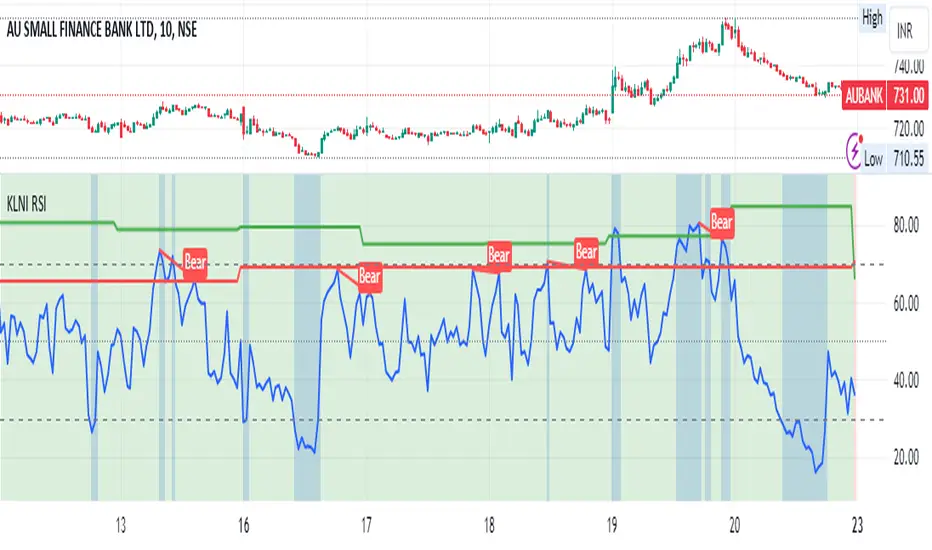
Plotting on Chart
The indicator will display three distinct RSI plots for the selected timeframes:
RSI TF1 (blue line) for the first timeframe.
RSI TF2 (green line) for the second timeframe.
RSI TF3 (red line) for the third timeframe.
Each RSI line corresponds to its chosen timeframe, allowing you to see how RSI behaves across different time periods.
Reading the RSI Values
Overbought: When RSI is above 70, the asset is considered overbought, potentially signaling a sell or short entry.
Oversold: When RSI is below 30, the asset is considered oversold, possibly indicating a buying opportunity.
Neutral: RSI around 50 is neutral and may suggest a lack of clear momentum.
Divergence Detection
If enabled, the indicator will highlight points of divergence:
Bullish Divergence: A green label will appear below the chart where price is making lower lows, but RSI is making higher lows, suggesting potential bullish momentum.
Bearish Divergence: A red label will appear when price is making higher highs, but RSI is making lower highs, indicating potential bearish pressure.
Practical Applications
Momentum Confirmation: Use this indicator to confirm the strength of a trend by comparing RSI across multiple timeframes. For example, if RSI is above 50 on all three timeframes, it may confirm strong upward momentum.
Overbought/Oversold Signals: When RSI is overbought on multiple timeframes, it could signal an impending reversal or correction. Conversely, oversold conditions across timeframes might indicate a buy opportunity.
Divergence Detection: Spot divergence between price and RSI to identify potential trend reversals early. Divergence can provide early signals of changing market momentum.
Summary
This indicator is a powerful tool for multi-timeframe RSI analysis, helping traders understand momentum shifts across different timeframes. It offers customizability, divergence detection, and visual aids to streamline your technical analysis and decision-making process.
The RSI Multi-Timeframe Indicator allows you to track and compare the Relative Strength Index (RSI) across three different timeframes on the same chart. This is particularly useful for traders who want to gauge the momentum of an asset over multiple time periods simultaneously, helping to make more informed trading decisions.
Key Features
Multi-Timeframe RSI:
You can select up to three timeframes to plot RSI on the same chart.
Available timeframe options include:
Current: Displays RSI for the current chart timeframe.
60 minutes (1 hour)
Daily
Weekly
Monthly
Custom RSI Settings:
Adjust the RSI length and source (e.g., close price) through user inputs, allowing you to tailor the indicator to your strategy.
Divergence Detection (Optional):
The indicator can optionally detect and display bullish and bearish divergences between price and RSI for the first selected timeframe.
Bullish divergence is shown when price makes a lower low, but RSI makes a higher low.
Bearish divergence is shown when price makes a higher high, but RSI makes a lower high.
Visual Aids:
Overbought and oversold RSI levels are highlighted with background colors for clarity.
Horizontal lines at 70 (overbought), 50 (neutral), and 30 (oversold) help quickly identify RSI conditions.
How to Use This Indicator
Inputs & Settings
Timeframe Settings:
First Timeframe: Choose the primary timeframe (e.g., 60 minutes, Daily, Weekly).
Second Timeframe: Select the second timeframe to plot on the chart.
Third Timeframe: Select the third timeframe for additional RSI analysis.
RSI Settings:
RSI Length: Set the period for RSI calculation (default: 14).
Source: Select the price data for RSI calculation (default: close price).
Show Divergence: Enable or disable the detection of divergence between price and RSI.
Plotting on Chart
The indicator will display three distinct RSI plots for the selected timeframes:
RSI TF1 (blue line) for the first timeframe.
RSI TF2 (green line) for the second timeframe.
RSI TF3 (red line) for the third timeframe.
Each RSI line corresponds to its chosen timeframe, allowing you to see how RSI behaves across different time periods.
Reading the RSI Values
Overbought: When RSI is above 70, the asset is considered overbought, potentially signaling a sell or short entry.
Oversold: When RSI is below 30, the asset is considered oversold, possibly indicating a buying opportunity.
Neutral: RSI around 50 is neutral and may suggest a lack of clear momentum.
Divergence Detection
If enabled, the indicator will highlight points of divergence:
Bullish Divergence: A green label will appear below the chart where price is making lower lows, but RSI is making higher lows, suggesting potential bullish momentum.
Bearish Divergence: A red label will appear when price is making higher highs, but RSI is making lower highs, indicating potential bearish pressure.
Practical Applications
Momentum Confirmation: Use this indicator to confirm the strength of a trend by comparing RSI across multiple timeframes. For example, if RSI is above 50 on all three timeframes, it may confirm strong upward momentum.
Overbought/Oversold Signals: When RSI is overbought on multiple timeframes, it could signal an impending reversal or correction. Conversely, oversold conditions across timeframes might indicate a buy opportunity.
Divergence Detection: Spot divergence between price and RSI to identify potential trend reversals early. Divergence can provide early signals of changing market momentum.
Summary
This indicator is a powerful tool for multi-timeframe RSI analysis, helping traders understand momentum shifts across different timeframes. It offers customizability, divergence detection, and visual aids to streamline your technical analysis and decision-making process.
Script open-source
Dans l'esprit TradingView, le créateur de ce script l'a rendu open source afin que les traders puissent examiner et vérifier ses fonctionnalités. Bravo à l'auteur! Bien que vous puissiez l'utiliser gratuitement, n'oubliez pas que la republication du code est soumise à nos Règles.
Clause de non-responsabilité
Les informations et publications ne sont pas destinées à être, et ne constituent pas, des conseils ou recommandations financiers, d'investissement, de trading ou autres fournis ou approuvés par TradingView. Pour en savoir plus, consultez les Conditions d'utilisation.