OPEN-SOURCE SCRIPT
Abdullah
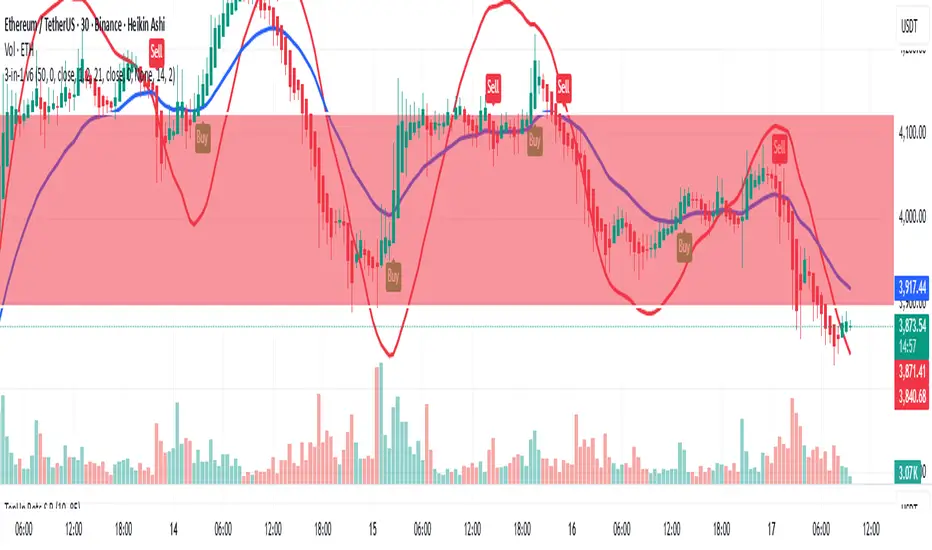
This script is a **3-in-1 Combined Indicator** for Pine Script v6, merging three popular technical analysis tools into a single chart overlay. It's designed to provide a comprehensive view of trend direction, momentum, and volatility-based stops.
Here's a breakdown of the three components:
## 1. ZLSMA - Zero Lag LSMA (Zero Lag Least Squares Moving Average)
The ZLSMA is a fast-reacting moving average that aims to eliminate the lag typically associated with standard moving averages. It does this by calculating the difference between a standard **Least Squares Moving Average (LSMA)** and a smoothed version of that LSMA, then adding that difference back to the original LSMA.
* **Customizable Inputs:** Length, Offset, and Source Price.
* **Plot:** A thick yellow line indicating the zero-lag trend.
---
## 2. Chandelier Exit
The Chandelier Exit is a volatility-based tool that places a trailing stop either above the price (for a long trade exit) or below the price (for a short trade exit). It uses the **Average True Range (ATR)** to set the stop distance.
* **Key Function:** Identifies potential stop-loss levels and trend changes.
* **Customizable Inputs:** ATR Period, ATR Multiplier, and an option to use the Close price for extremum calculations.
* **Visuals:**
* Plots the **Long Stop (Green)** and **Short Stop (Red)** lines, which switch based on the current trend direction.
* Optional **Buy/Sell Labels** and **Highlighting** (shaded background) to clearly mark the current trend state (long or short).
---
## 3. Exponential Moving Average (EMA) with Optional Smoothing Bands
This section plots a standard **Exponential Moving Average (EMA)** and includes a unique feature to smooth the EMA's output using another moving average or Bollinger Bands.
* **EMA Plot:** A blue line representing the EMA, with customizable Length, Source, and Offset.
* **Optional Smoothing:** The EMA line itself can be smoothed by applying a secondary moving average (SMA, EMA, WMA, etc.) to the EMA's values.
* **Bollinger Bands Option:** If **SMA + Bollinger Bands** is selected for smoothing, it plots **Upper** and **Lower Bands** based on the standard deviation of the EMA, providing a visual envelope for volatility around the smoothed line.
Script open-source
Dans l'esprit TradingView, le créateur de ce script l'a rendu open source afin que les traders puissent examiner et vérifier ses fonctionnalités. Bravo à l'auteur! Bien que vous puissiez l'utiliser gratuitement, n'oubliez pas que la republication du code est soumise à nos Règles.
Clause de non-responsabilité
Les informations et publications ne sont pas destinées à être, et ne constituent pas, des conseils ou recommandations financiers, d'investissement, de trading ou autres fournis ou approuvés par TradingView. Pour en savoir plus, consultez les Conditions d'utilisation.