PROTECTED SOURCE SCRIPT
Updated CVDD + Terminal Price Indicator + Z-SCORE
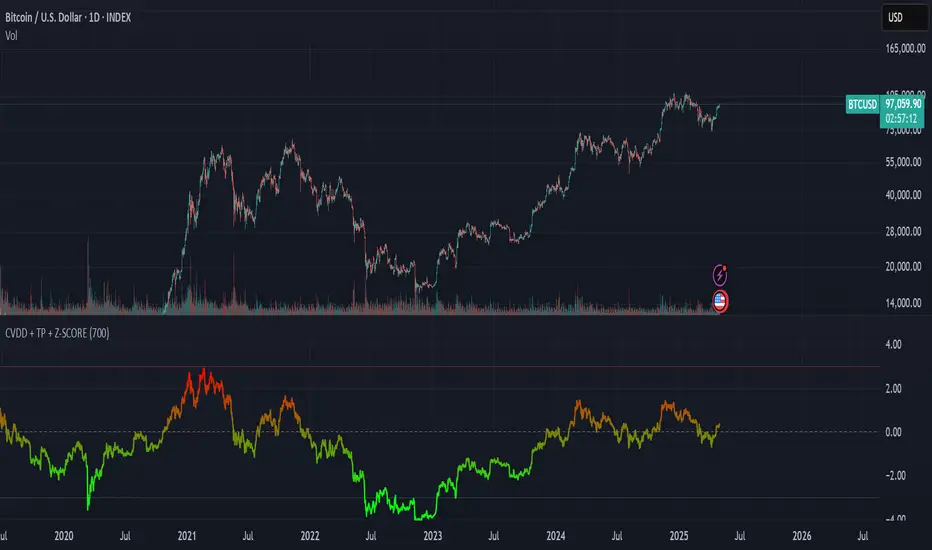
This custom indicator is designed to help identify major overvaluation and undervaluation zones in Bitcoin's market cycles by analyzing price behavior relative to long-term on-chain benchmarks.
It leverages two well-known valuation models — CVDD (Cumulative Value Days Destroyed) and Terminal Price — to define a dynamic valuation range that adapts over time. These reference points are combined with a custom Z-score framework to evaluate how extended price is compared to long-term value zones.
The result is a normalized oscillator that highlights extremes in market sentiment, ranging from –3 (potential deep value) to +3 (potential overheated conditions), with a gradient color scale for quick visual interpretation.
This tool is especially useful for long-term investors and macro analysts seeking signals of potential market tops and bottoms based on deep on-chain behavior — rather than short-term technicals.
Release Notes
This custom indicator is designed to help identify major overvaluation and undervaluation zones in Bitcoin's market cycles by analyzing price behavior relative to long-term on-chain benchmarks.It leverages two well-known valuation models — CVDD (Cumulative Value Days Destroyed) and Terminal Price — to define a dynamic valuation range that adapts over time. These reference points are combined with a custom Z-score framework to evaluate how extended price is compared to long-term value zones.
The result is a normalized oscillator that highlights extremes in market sentiment, ranging from –3 (potential deep value) to +3 (potential overheated conditions), with a gradient color scale for quick visual interpretation.
This tool is especially useful for long-term investors and macro analysts seeking signals of potential market tops and bottoms based on deep on-chain behavior — rather than short-term technicals.
Protected script
This script is published as closed-source. However, you can use it freely and without any limitations – learn more here.
Disclaimer
The information and publications are not meant to be, and do not constitute, financial, investment, trading, or other types of advice or recommendations supplied or endorsed by TradingView. Read more in the Terms of Use.