OPEN-SOURCE SCRIPT
IchiMAMA (Experimental)
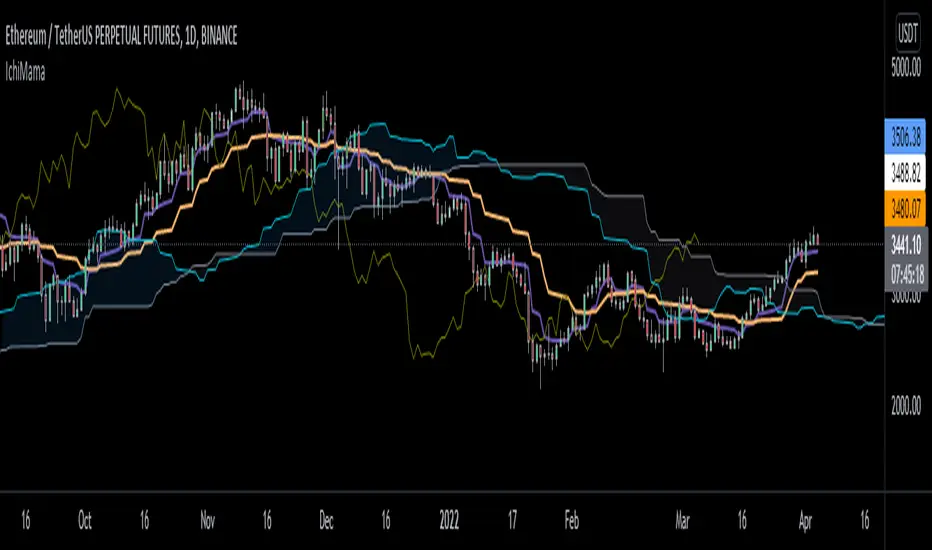
Goichi Hosoda's "Ichimoku Kinkō Hyō" is a widely used Trend Following indicator and can be defined as a "system" rather than an indicator.
Published in the late 1960's, consisting of 5 lines.
TenkanSen (Conversion Line) = [Highest High + Lowest Low/2] of the last 9 bars
KijunSen (Base Line) = [Highest High + Lowest Low/2] of the last 26 bars
SenkouSpanA (Leading Span A) = Average of Tenkan&KijunSen shifted -> 26 bars
SenkouSpanB (Leading Span B) = [Highest High + Lowest Low/2] of the last 52 bars
ChikouSpan (Lagging Span) = Price shifted <- 26 bars
On the other hand, Mesa Adaptive Moving Average developed by John Ehlers around early 2000's shows similarities with Hosoda's Tenkan and KijunSen using a different calculation method. For futher info: mesasoftware.com/papers/MAMA.pdf
I find MAMA superior to TenkanSen and KijunSen in terms of crossing signals.
Ichimoku:

Thus, decided to replace TenkanSen and KijunSen of regular Ichimoku with MAMA&FAMA of Ehlers and calculated SenkouSpanA accordingly. SenkouSpanB and ChikouSpan stays the same as per Ichimoku's logic. (Periods are 30 by default for cryptocurrencies. If stocks then 26)
IchiMAMA:

This is purely experimental and educational. Hope you'll like it :)
I'd like to thank everget for MAMA&FAMA
and KivancOzbilgic for Ichimoku Kinkō Hyō and Volume Based Colored Bars
Published in the late 1960's, consisting of 5 lines.
TenkanSen (Conversion Line) = [Highest High + Lowest Low/2] of the last 9 bars
KijunSen (Base Line) = [Highest High + Lowest Low/2] of the last 26 bars
SenkouSpanA (Leading Span A) = Average of Tenkan&KijunSen shifted -> 26 bars
SenkouSpanB (Leading Span B) = [Highest High + Lowest Low/2] of the last 52 bars
ChikouSpan (Lagging Span) = Price shifted <- 26 bars
On the other hand, Mesa Adaptive Moving Average developed by John Ehlers around early 2000's shows similarities with Hosoda's Tenkan and KijunSen using a different calculation method. For futher info: mesasoftware.com/papers/MAMA.pdf
I find MAMA superior to TenkanSen and KijunSen in terms of crossing signals.
Ichimoku:
Thus, decided to replace TenkanSen and KijunSen of regular Ichimoku with MAMA&FAMA of Ehlers and calculated SenkouSpanA accordingly. SenkouSpanB and ChikouSpan stays the same as per Ichimoku's logic. (Periods are 30 by default for cryptocurrencies. If stocks then 26)
IchiMAMA:
This is purely experimental and educational. Hope you'll like it :)
I'd like to thank everget for MAMA&FAMA
and KivancOzbilgic for Ichimoku Kinkō Hyō and Volume Based Colored Bars
Script open-source
Dans l'esprit TradingView, le créateur de ce script l'a rendu open source afin que les traders puissent examiner et vérifier ses fonctionnalités. Bravo à l'auteur! Bien que vous puissiez l'utiliser gratuitement, n'oubliez pas que la republication du code est soumise à nos Règles.
Clause de non-responsabilité
Les informations et publications ne sont pas destinées à être, et ne constituent pas, des conseils ou recommandations financiers, d'investissement, de trading ou autres fournis ou approuvés par TradingView. Pour en savoir plus, consultez les Conditions d'utilisation.