PROTECTED SOURCE SCRIPT
GG [AYC]
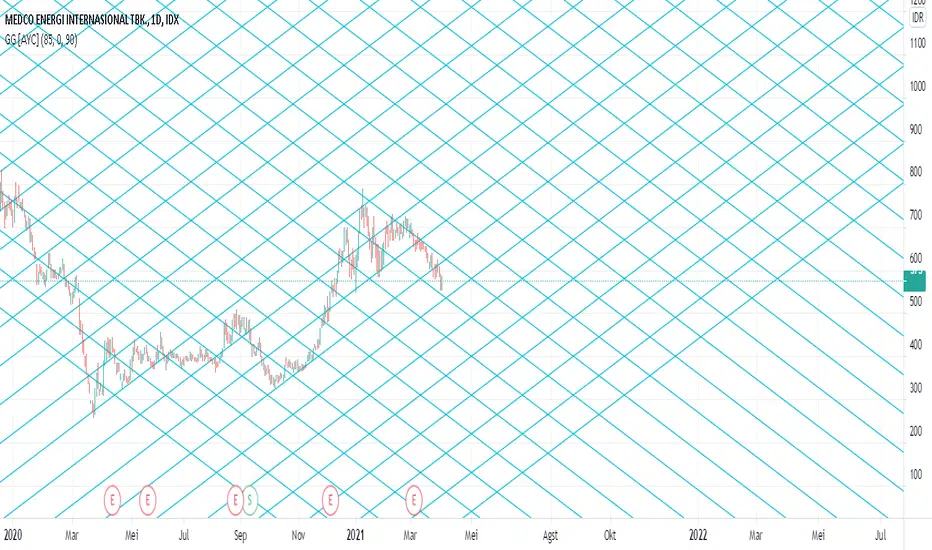
This indicator basically works like Gann Grid indicator that can be used as an SNR , making it easier to draw diagonal lines with the same price difference for each line.
The change in SNR in a market can be in the form of a certain gap/point number according to its characteristics.
Entering these numbers can make it easier for traders to determine SNR for better profit.
How to use :
1.Enter "Price" (Extreme Low)
2.Enter "Price Step" (It doesn't really important, just in case the line is not enough, because tradingview has limitations in plotting lines), Default is "0" & Step is "270"
3.Enter "Point" that you want as SNR , 90 is the default for the stock market.
4.Choose "Start"
Start = The start date of the cycle of price movements
5.Choose "End"
End = The end date of the cycle of price movements
Script protégé
Ce script est publié en source fermée. Cependant, vous pouvez l'utiliser librement et sans aucune restriction – pour en savoir plus, cliquez ici.
Clause de non-responsabilité
Les informations et publications ne sont pas destinées à être, et ne constituent pas, des conseils ou recommandations financiers, d'investissement, de trading ou autres fournis ou approuvés par TradingView. Pour en savoir plus, consultez les Conditions d'utilisation.