PROTECTED SOURCE SCRIPT
Mis à jour Rs Candlestick Indicator With Moving Averages
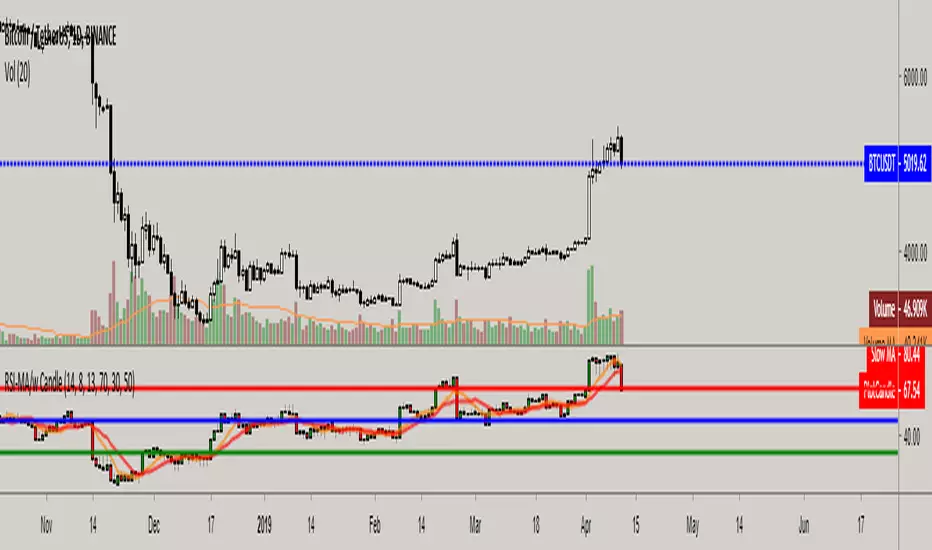
Unlike the traditional RSI, this one offers you an detailed insight with candlestick chart, rather than a simple line setup. It also includes two different customizable moving average(s) and offers detailed information such as bullish/bearish candlestick formations, negative and positive divergences on indicator.
How to use: Similar to candlestick charts, whenever Rsi candle close and stays above moving average(s) it's a buy signal and whenever candle closes below moving average(s), that's a sell signal. Rather than waiting for Rsi to break mid-line(50) to buy and sell, this one offers dynamic and more accurate buy and sell signals. You can also customize top-mid-bottom line values as well to determine overbought and oversold levels.
How to use: Similar to candlestick charts, whenever Rsi candle close and stays above moving average(s) it's a buy signal and whenever candle closes below moving average(s), that's a sell signal. Rather than waiting for Rsi to break mid-line(50) to buy and sell, this one offers dynamic and more accurate buy and sell signals. You can also customize top-mid-bottom line values as well to determine overbought and oversold levels.
Notes de version
Added mid-line color.Script protégé
Ce script est publié en source fermée. Cependant, vous pouvez l'utiliser librement et sans aucune restriction – pour en savoir plus, cliquez ici.
Clause de non-responsabilité
Les informations et publications ne sont pas destinées à être, et ne constituent pas, des conseils ou recommandations financiers, d'investissement, de trading ou autres fournis ou approuvés par TradingView. Pour en savoir plus, consultez les Conditions d'utilisation.
Script protégé
Ce script est publié en source fermée. Cependant, vous pouvez l'utiliser librement et sans aucune restriction – pour en savoir plus, cliquez ici.
Clause de non-responsabilité
Les informations et publications ne sont pas destinées à être, et ne constituent pas, des conseils ou recommandations financiers, d'investissement, de trading ou autres fournis ou approuvés par TradingView. Pour en savoir plus, consultez les Conditions d'utilisation.