OPEN-SOURCE SCRIPT
% Stocks Above MA
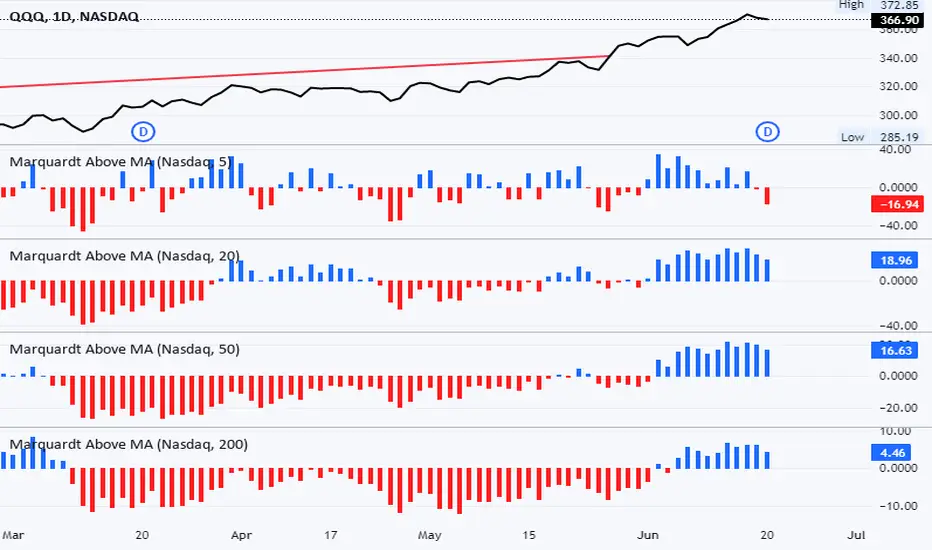
Breadth indicator showing % stocks above various moving averages. Histogram is positive (blue) when % stocks above selected MA is greater than 50%. Histogram is negative (red) when % of stocks above selected MA is less than 50%. Data manipulation causes the actual % value in y-axis to be incorrect but enhances visualization. Actual %'s are simply the displayed values + 50.
Improvements / suggestions welcome.
Improvements / suggestions welcome.
Script open-source
Dans l'esprit TradingView, le créateur de ce script l'a rendu open source afin que les traders puissent examiner et vérifier ses fonctionnalités. Bravo à l'auteur! Bien que vous puissiez l'utiliser gratuitement, n'oubliez pas que la republication du code est soumise à nos Règles.
Clause de non-responsabilité
Les informations et publications ne sont pas destinées à être, et ne constituent pas, des conseils ou recommandations financiers, d'investissement, de trading ou autres fournis ou approuvés par TradingView. Pour en savoir plus, consultez les Conditions d'utilisation.