PROTECTED SOURCE SCRIPT
ueuito Custom Moving Averages and VWMA Trend

Description in English:
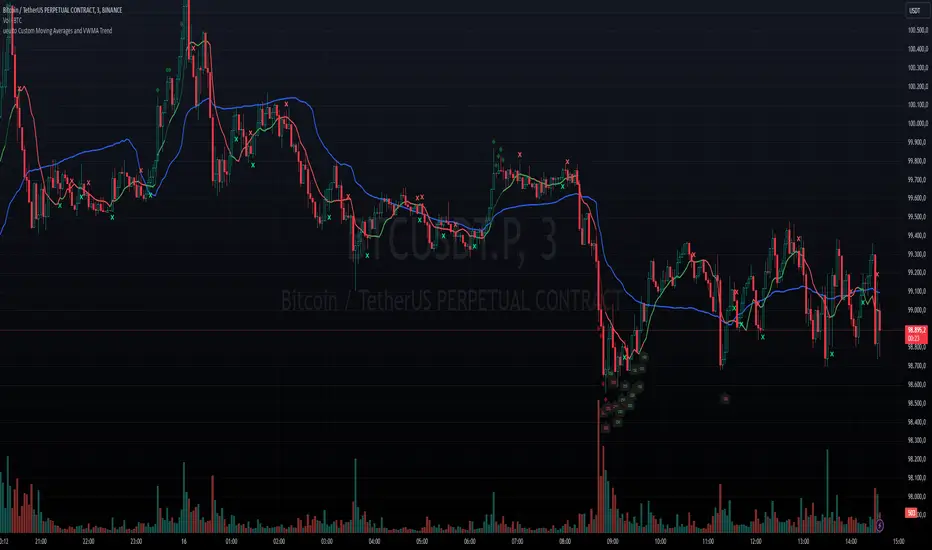
is a customizable indicator that combines multiple technical analysis tools to identify market trends and buy/sell signals. It integrates moving averages (including VWMA), RSI, MACD, and various configurable levels, providing detailed visual analysis on the chart.
Key Features:
Customizable Moving Averages:
Supports SMA, EMA, WMA, VWMA, and RMA.
Allows for customizing the period and displaying up to two moving averages simultaneously.
VWMA with RSI Indication:
VWMA changes color based on RSI conditions:
Overbought color when RSI exceeds a configurable level.
Oversold color when RSI drops below a configurable level.
MACD and Crossovers:
Detects MACD crossovers with the signal line and highlights them on the chart.
Includes visual indicators to mark key moments of MACD rising or falling.
Overbought/Oversold Signals:
Adds visual markers when RSI exceeds user-defined levels (overbought or oversold).
MACD Level Indicators:
Displays specific values on the chart when MACD reaches predefined levels, with color adjustments based on trend direction.
Advanced Configurations:
Configurable parameters for vertical offset, label colors, and alert levels.
Provides flexibility to tailor the indicator’s appearance and behavior.
Still improving...
Script protégé
Ce script est publié en source fermée. Cependant, vous pouvez l'utiliser librement et sans aucune restriction – pour en savoir plus, cliquez ici.
Clause de non-responsabilité
Les informations et publications ne sont pas destinées à être, et ne constituent pas, des conseils ou recommandations financiers, d'investissement, de trading ou autres fournis ou approuvés par TradingView. Pour en savoir plus, consultez les Conditions d'utilisation.