OPEN-SOURCE SCRIPT
Mis à jour Price relation viewer - add percent change of two symbols (BETA)
This script is very much beta!
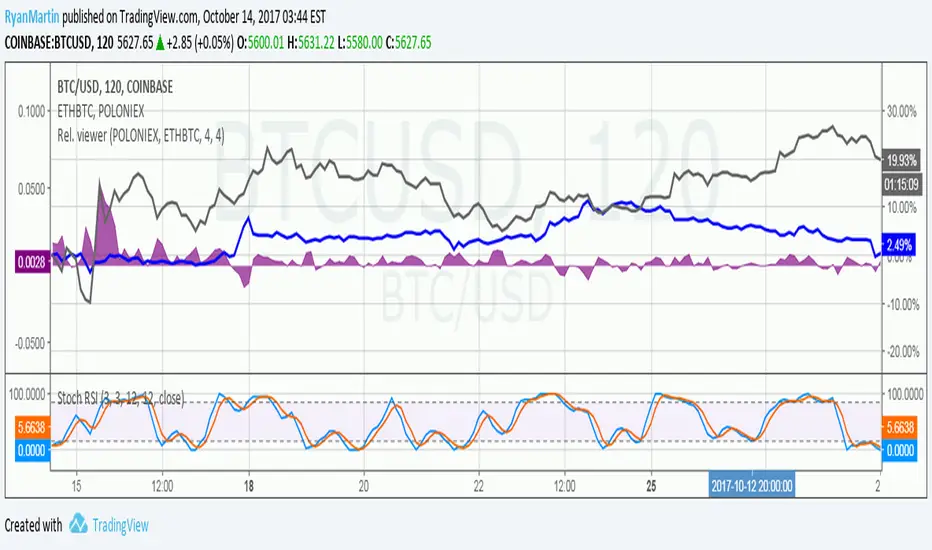
This is a simple script to visualize how two symbols move in relation to each other. For example if the underlying symbol is a 2x Gold ETF (meaning the ticker moves at 2x the spot price of gold---if gold goes up 3% this ticker should go up 6%) and the comparison symbol is an 2x inverse gold ETF (at gold up 3% this should move down 6%). If these ETFs were 100% accurate at tracking the price of gold then this tool would report a value of zero at all times.
Day 1
Ticker - $10
Comparison - $10
Day 2
Ticker - $12
Comp - $11
This tool value - |20%| + -|10%| = 10%
It uses a short simple moving average to smooth things out a bit (see inputs). It is important to keep your axis scale in mind when using this! Two symbols that are always near zero mean they are offsetting each other very well but the value displayed might range from 0 to 0.005, but the graphed area can make it look extreme if autoscaled.
This is a tool with very specific uses: comparing how one digital currency moves in relation to bitcoin's price, comparing how gold moves in relation to silver, etc.
Notes de version
NO LONGER ADDS PERCENT CHANGE OF TWO SYMBOLS! SIMPLY MEASURES CORRELATION.indicator now uses Pine's correlation built-in function. Very simple script at this point. When area drawing tracks negative there is an inverse correlatin between the underlying symbol and symbol being compared. Area between 0 and 1 indicates compared symbol moves in same direction.
Uses Pearson correlation. Going forward this script may be updated to use Spearman correlation or other ranked correlation measure; used either by itself or as part of a weighted indicator that is a combination (i.e. r^2, Spearman, and price elasticity together)
Higher moving average vals are better for shorter time intervals (>20 seems more appropriate for time views <1 hour)
Script is very basic at this point, take with a grain of salt.
Script open-source
Dans l'esprit TradingView, le créateur de ce script l'a rendu open source afin que les traders puissent examiner et vérifier ses fonctionnalités. Bravo à l'auteur! Bien que vous puissiez l'utiliser gratuitement, n'oubliez pas que la republication du code est soumise à nos Règles.
Clause de non-responsabilité
Les informations et publications ne sont pas destinées à être, et ne constituent pas, des conseils ou recommandations financiers, d'investissement, de trading ou autres fournis ou approuvés par TradingView. Pour en savoir plus, consultez les Conditions d'utilisation.