OPEN-SOURCE SCRIPT
Multi-TF EMA 5/8-ChartTicker-Dashboard
⚙️ Key Components
Timeframes & Weights
Uses 5 different intraday timeframes: 2m, 5m, 15m, 30m, 60m.
Each TF has a weight:
2m = 1
5m = 2
15m = 4
30m = 8
60m = 16
👉 Higher timeframe signals contribute more to the total.
Signal Logic per Timeframe
For each TF, calculate EMA 5 and EMA 8.
If EMA5 > EMA8 → Buy (B, +1).
If EMA5 < EMA8 → Sell (S, –1).
Total Score Calculation
Each signal (+1 or –1) is multiplied by its timeframe weight.
All weighted signals are summed into a total score.
Positive = bullish bias, negative = bearish bias.
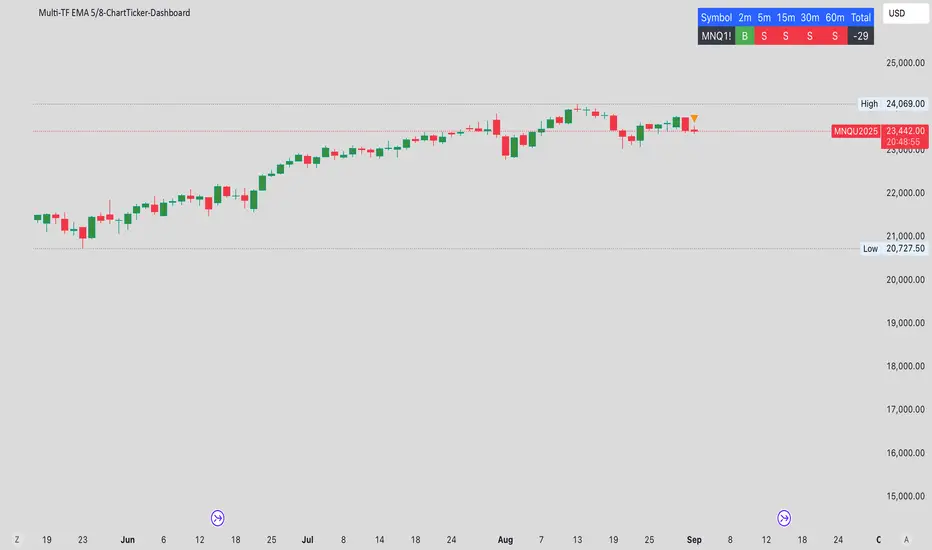
Dashboard Table (top-right corner)
Row 1 (header): Symbol, each timeframe (2m, 5m, 15m, 30m, 60m), Total.
Row 2 (values):
Symbol name.
B (green) or S (red) per timeframe.
Weighted Total score.
🛠️ Overall Function
This indicator is essentially a multi-timeframe EMA trend dashboard that:
Shows Buy/Sell alignment across multiple TFs.
Provides a weighted trend score to quickly assess market bias.
Makes it easy to spot whether short- and long-term signals agree or conflict.
Timeframes & Weights
Uses 5 different intraday timeframes: 2m, 5m, 15m, 30m, 60m.
Each TF has a weight:
2m = 1
5m = 2
15m = 4
30m = 8
60m = 16
👉 Higher timeframe signals contribute more to the total.
Signal Logic per Timeframe
For each TF, calculate EMA 5 and EMA 8.
If EMA5 > EMA8 → Buy (B, +1).
If EMA5 < EMA8 → Sell (S, –1).
Total Score Calculation
Each signal (+1 or –1) is multiplied by its timeframe weight.
All weighted signals are summed into a total score.
Positive = bullish bias, negative = bearish bias.
Dashboard Table (top-right corner)
Row 1 (header): Symbol, each timeframe (2m, 5m, 15m, 30m, 60m), Total.
Row 2 (values):
Symbol name.
B (green) or S (red) per timeframe.
Weighted Total score.
🛠️ Overall Function
This indicator is essentially a multi-timeframe EMA trend dashboard that:
Shows Buy/Sell alignment across multiple TFs.
Provides a weighted trend score to quickly assess market bias.
Makes it easy to spot whether short- and long-term signals agree or conflict.
Script open-source
Dans l'esprit de TradingView, le créateur de ce script l'a rendu open-source, afin que les traders puissent examiner et vérifier sa fonctionnalité. Bravo à l'auteur! Vous pouvez l'utiliser gratuitement, mais n'oubliez pas que la republication du code est soumise à nos Règles.
Clause de non-responsabilité
Les informations et les publications ne sont pas destinées à être, et ne constituent pas, des conseils ou des recommandations en matière de finance, d'investissement, de trading ou d'autres types de conseils fournis ou approuvés par TradingView. Pour en savoir plus, consultez les Conditions d'utilisation.