OPEN-SOURCE SCRIPT
Mis à jour © AlpHay : FINRA SHORT DATA REPORT TABLE with QUANDL Data
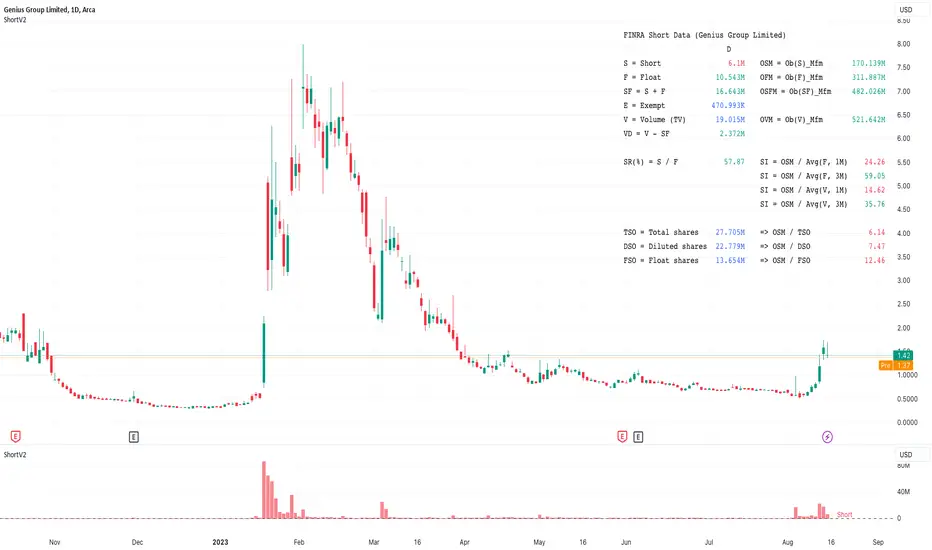
// Equity Short Data Report Table:
// Data Provider: Quandl => Finra (Nyse + Nasdaq + Bats exchanges)
// I am not a financial advisor or expert.
// This is my interpretation of FINRA's data. Consider this data doesn't represent the whole picture of what is going on!
// If you find some fundementally wrong thinking about this aproach, please inform me.
// I am open to suggestions. I am also looking for answers.
// Use it with a daily timeframe for data consistency.
// You can change the threshold values whatever you want.
// MFM (Money Flow Multiplier):
// mfm = close == high and close == low or high == low ? 0 : (2 * close - low - high) / (high - low)
Notes de version
Currency symbol removed.Notes de version
Chart view changed.Notes de version
added some references.Notes de version
* The second version of the "FINRA" short data analysis.* You can use either "Table" or "Oscillator" mode. (if you choose oscillator mode, be sure to add an indicator as an oscillator. then Choose "OSC" from Modes)
* "Mobile" page layout for lighter daily usage (for Table use only).
* more reliable code.
* easy to customize.
Disclaimer and Warning!
* Do not forget this is my Interpolation of the data sets. You can't invest in relying on this indicator. This is just a visual representation of the data sets.
* The base assumption is (obviously, Everybody is trying to figure it out 🥺) Unclosed "Short" Positions. As you may know, this is an ongoing process, not a constant state.
1) MFM ("Money Flow Multiplier") gives me an understanding of what net position is (either "float" or "short") daily basis—Sentiment of the day.
2) Then, I use the "On Balance Volume" formula for this value. Depending on "short" or "float."
3) OSM_MFM is my prediction for Unclosed Short Positions.
Finra supply on three primary exchange data freely. Don't forget there are min 30 exchanges. and "Equity Swaps" and "Total Return Swaps."
Etc etc. 🫣
Don't lose hope. Just be careful what you wish for. And search for anomalies.
I hope you enjoy it.
Script open-source
Dans l'esprit TradingView, le créateur de ce script l'a rendu open source afin que les traders puissent examiner et vérifier ses fonctionnalités. Bravo à l'auteur! Bien que vous puissiez l'utiliser gratuitement, n'oubliez pas que la republication du code est soumise à nos Règles.
Clause de non-responsabilité
Les informations et publications ne sont pas destinées à être, et ne constituent pas, des conseils ou recommandations financiers, d'investissement, de trading ou autres fournis ou approuvés par TradingView. Pour en savoir plus, consultez les Conditions d'utilisation.