OPEN-SOURCE SCRIPT
Candle Counter from 9:30 AM to 4:00 PM
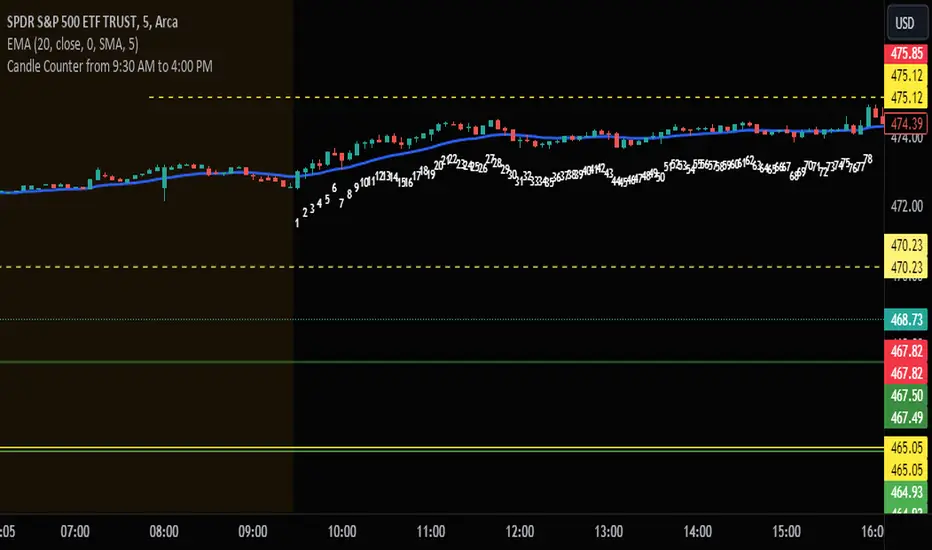
This Pine Script, designed for TradingView, serves as a candle counter exclusively for a 5-minute chart. It operates within the specific market hours of 9:30 AM to 4:00 PM. Key features of the script include:
Market Hours Specification: The script is configured to track candles only during the trading hours from 9:30 AM to 4:00 PM.
Daily Reset: Each trading day, the candle counter resets, starting anew from the market opening at 9:30 AM.
Candle Counting: It increments a counter with each 5-minute candle during the specified market hours.
Label Display: The counter number for each candle is displayed as a label at the candle's low point. This label is in bright white color with large font size, ensuring clear visibility against various chart backgrounds.
5-Minute Chart Specificity: The script is tailored to function only when the chart is set to a 5-minute timeframe, making it ideal for traders focusing on intraday movements.
New Day Detection: Utilizes a function to identify the start of a new trading day, ensuring accurate daily counting.
This script is particularly useful for traders who focus on intraday trading within the standard stock market hours, providing a clear and easy-to-read candle count that resets daily.
Script open-source
Dans l'esprit TradingView, le créateur de ce script l'a rendu open source afin que les traders puissent examiner et vérifier ses fonctionnalités. Bravo à l'auteur! Bien que vous puissiez l'utiliser gratuitement, n'oubliez pas que la republication du code est soumise à nos Règles.
Clause de non-responsabilité
Les informations et publications ne sont pas destinées à être, et ne constituent pas, des conseils ou recommandations financiers, d'investissement, de trading ou autres fournis ou approuvés par TradingView. Pour en savoir plus, consultez les Conditions d'utilisation.