OPEN-SOURCE SCRIPT
UCS_Extreme Snap Back (TVI)
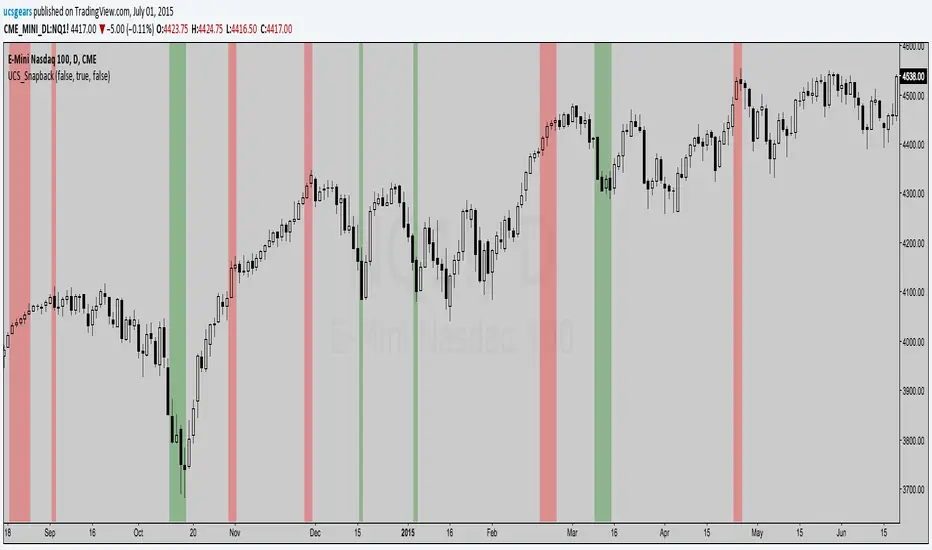
I am calling it a SNAP BACK indicator.
Utilizing the TVI (Transactional Value Index - Link below for indicator / setups)
You can pretty much guess when any instrument could slow down, last stand in a pullback and the last few candles before losing its strong trend.
It varies per person, a short term trader can use this, Long term traders can hedge with options.
A great tool for my trading. Thought I will share this.

This utilizes TVI indicator, currently the TVI is manipulated manually, I have automated a version for future release.
Embrace trading - keep the money flowing.
Utilizing the TVI (Transactional Value Index - Link below for indicator / setups)
You can pretty much guess when any instrument could slow down, last stand in a pullback and the last few candles before losing its strong trend.
It varies per person, a short term trader can use this, Long term traders can hedge with options.
A great tool for my trading. Thought I will share this.
This utilizes TVI indicator, currently the TVI is manipulated manually, I have automated a version for future release.
Embrace trading - keep the money flowing.
Script open-source
Dans l'esprit de TradingView, le créateur de ce script l'a rendu open-source, afin que les traders puissent examiner et vérifier sa fonctionnalité. Bravo à l'auteur! Vous pouvez l'utiliser gratuitement, mais n'oubliez pas que la republication du code est soumise à nos Règles.
Uday C Santhakumar
Clause de non-responsabilité
Les informations et les publications ne sont pas destinées à être, et ne constituent pas, des conseils ou des recommandations en matière de finance, d'investissement, de trading ou d'autres types de conseils fournis ou approuvés par TradingView. Pour en savoir plus, consultez les Conditions d'utilisation.