OPEN-SOURCE SCRIPT
Mis à jour Logarithmic Volume
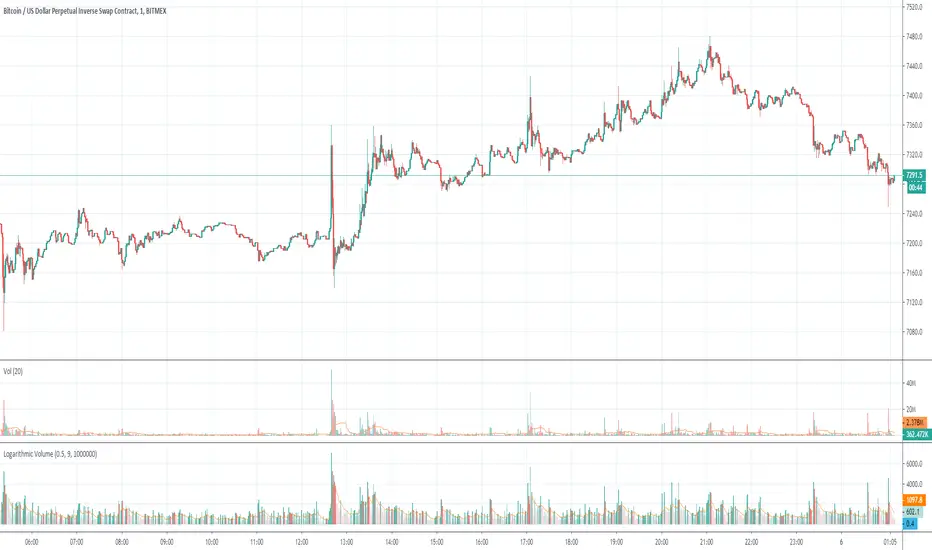
In volatile markets, normal indicator suffer from volume spikes that make the rest of plot seem non-existent.
Using logarithmic exponent, this indicator normalizes the volume, so this makes it easier to read.
The obvious drawback is that it does not display the actual volume amount, only a relative value.
Using logarithmic exponent, this indicator normalizes the volume, so this makes it easier to read.
The obvious drawback is that it does not display the actual volume amount, only a relative value.
Notes de version
Included the original volume indicator in the screenshot so you can see the difference.Notes de version
Fixed incorrect bar colors, note: it's actually intended to be green on rising volume and red on declining volume.Notes de version
I found the way to include the original volume data on the chart!The actual volume is being divided by a large number, so it doesn't break the chart.
The outcome value is small and transparent, yet it's still printed on the chart.
In this example it is divided by 1000000 or one million bitmex contracts.
Script open-source
Dans l'esprit TradingView, le créateur de ce script l'a rendu open source afin que les traders puissent examiner et vérifier ses fonctionnalités. Bravo à l'auteur! Bien que vous puissiez l'utiliser gratuitement, n'oubliez pas que la republication du code est soumise à nos Règles.
Clause de non-responsabilité
Les informations et publications ne sont pas destinées à être, et ne constituent pas, des conseils ou recommandations financiers, d'investissement, de trading ou autres fournis ou approuvés par TradingView. Pour en savoir plus, consultez les Conditions d'utilisation.