OPEN-SOURCE SCRIPT
Mis à jour Relative Strength Index; expert

How to use
Uptrend
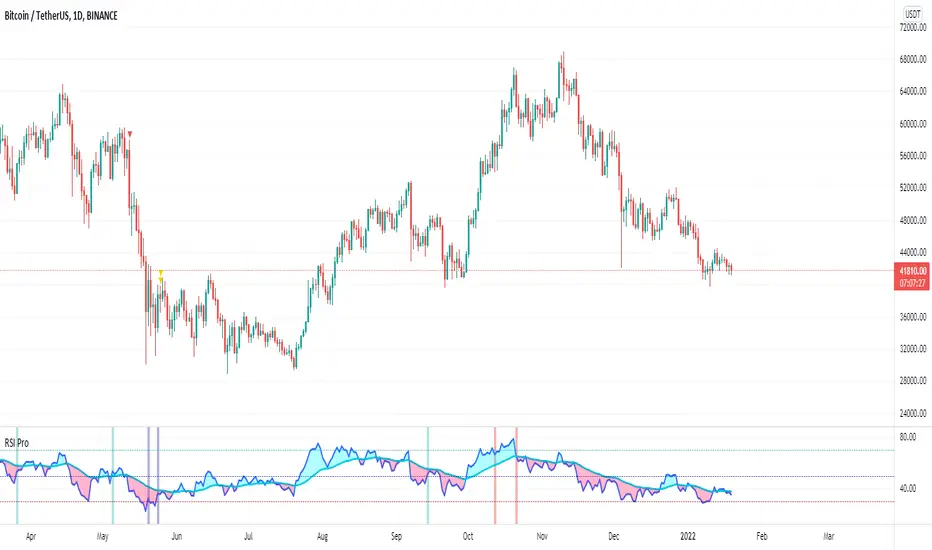
Buy or Long on dip when RSI>50 or similar, RSI>Signal line and Divergence.
Downtrend
Short on dip(for a downtrend) when RSI<50 or similar, RSI<Signal line and Divergence(for a downtrend).
And you can use RSI to see if the trend has been braked yet. By drawing trend lines on RSI.
Sorry, I'm not good at English. But I am studying to be able to communicate better.
Good luck :)
Firstssk,
Notes de version
HelloI've made some minor adjustments to the conditions to help reduce signal errors. The colors used have also been improved and color tabs have been added to aid observation.
The different color tabs can be interpreted as follows.
Pastel Green : Consider buying
Pastel Red : Consider selling
Pastel Blue: Prepare to buy as the price has moved too deeply. and may be adjusted soon
Pastel Yellow : Prepare to sell as the price has gone too high in no time. There may be a profitable sell-off.
This should be considered in various parts to reduce the risks that may occur.
Finally, we would like to thank you for your interest. If you want to suggest anything, you can let me know. And we will consider for further improvement. Thank you.
Notes de version
Update!!1.Improved script.
2.improve signal conditions.
3.Add color to make it easier to spot.
Hope it will be helpful to you.
Script open-source
Dans l'esprit TradingView, le créateur de ce script l'a rendu open source afin que les traders puissent examiner et vérifier ses fonctionnalités. Bravo à l'auteur! Bien que vous puissiez l'utiliser gratuitement, n'oubliez pas que la republication du code est soumise à nos Règles.
Clause de non-responsabilité
Les informations et publications ne sont pas destinées à être, et ne constituent pas, des conseils ou recommandations financiers, d'investissement, de trading ou autres fournis ou approuvés par TradingView. Pour en savoir plus, consultez les Conditions d'utilisation.