OPEN-SOURCE SCRIPT
Delta Volume Heatmap
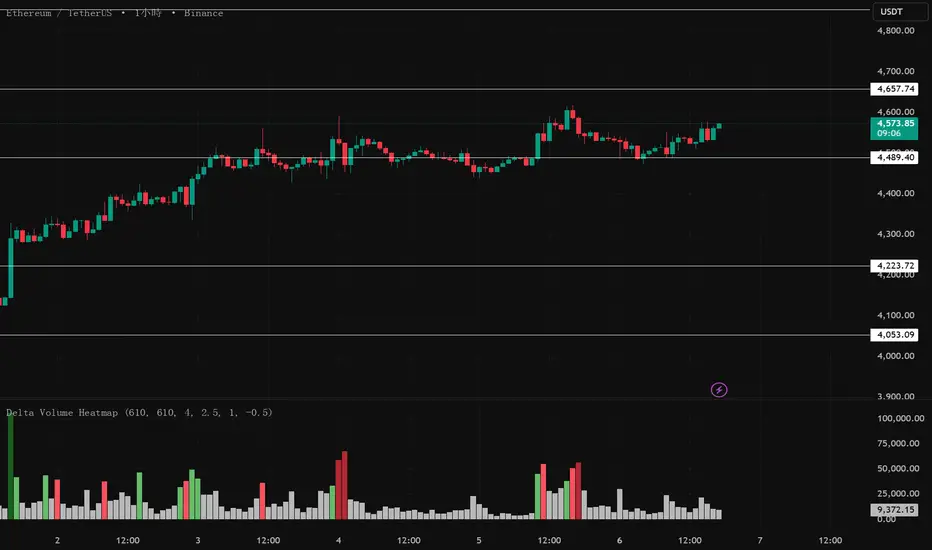
🔥 Delta Volume Heatmap
The Delta Volume Heatmap visualizes the real-time strength of per-bar delta volume — highlighting the imbalance between buying and selling pressure.
Each column’s color intensity reflects how strong the delta volume deviates from its moving average and standard deviation.
🟩 Green tones = Buy-dominant activity (bullish imbalance)
🟥 Red tones = Sell-dominant activity (bearish imbalance)
This tool helps traders quickly identify:
Abnormal volume spikes
Absorption or exhaustion zones
Potential reversal or continuation signals
Script open-source
Dans l'esprit TradingView, le créateur de ce script l'a rendu open source afin que les traders puissent examiner et vérifier ses fonctionnalités. Bravo à l'auteur! Bien que vous puissiez l'utiliser gratuitement, n'oubliez pas que la republication du code est soumise à nos Règles.
Clause de non-responsabilité
Les informations et publications ne sont pas destinées à être, et ne constituent pas, des conseils ou recommandations financiers, d'investissement, de trading ou autres fournis ou approuvés par TradingView. Pour en savoir plus, consultez les Conditions d'utilisation.