OPEN-SOURCE SCRIPT
RSI Multi TF strategy
The RSI is a very popular indicator that follows price activity.
It calculates an average of the positive net changes, and an average
of the negative net changes in the most recent bars, and it determines
the ratio between these averages. The result is expressed as a number
between 0 and 100. Commonly it is said that if the RSI has a low value,
for example, 30 or under, the symbol is oversold. And if the RSI has a
high value, 70 for example, the symbol is overbought.
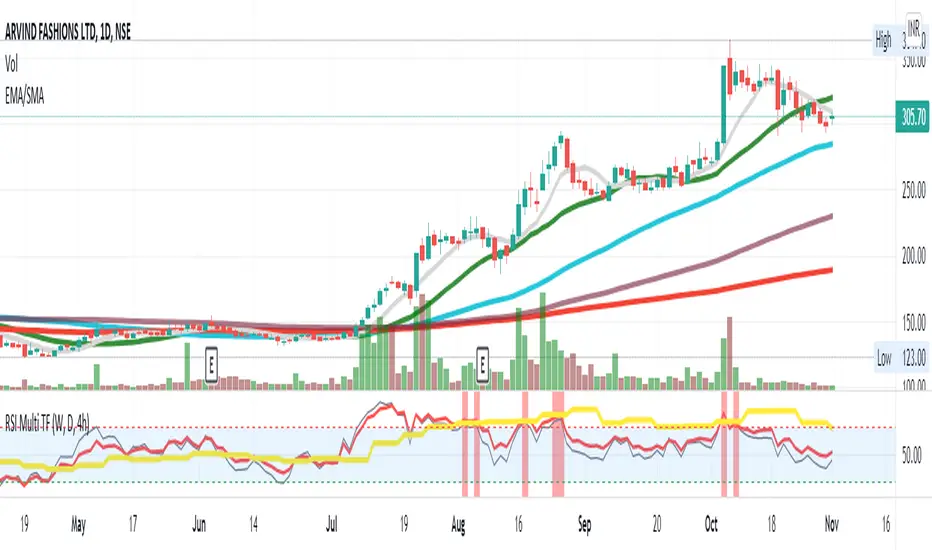
Plots 3 RSI (Weekly, Daily, 4h) at the same time, regardless of the Chart Timeframe.
Highlights in green (or red) if all RSI is oversold (or overbought).
Can trigger custom oversold and overbought alerts when all 3 lines grey(4h), yellow(weekly), and red(daily) go in the oversold or overbought zone. The strongest the curves break the barrier the strongest the alert (vertical red and green bars) shows.
Script open-source
Dans l'esprit TradingView, le créateur de ce script l'a rendu open source afin que les traders puissent examiner et vérifier ses fonctionnalités. Bravo à l'auteur! Bien que vous puissiez l'utiliser gratuitement, n'oubliez pas que la republication du code est soumise à nos Règles.
Clause de non-responsabilité
Les informations et publications ne sont pas destinées à être, et ne constituent pas, des conseils ou recommandations financiers, d'investissement, de trading ou autres fournis ou approuvés par TradingView. Pour en savoir plus, consultez les Conditions d'utilisation.