PROTECTED SOURCE SCRIPT
High/Low Percentage Difference
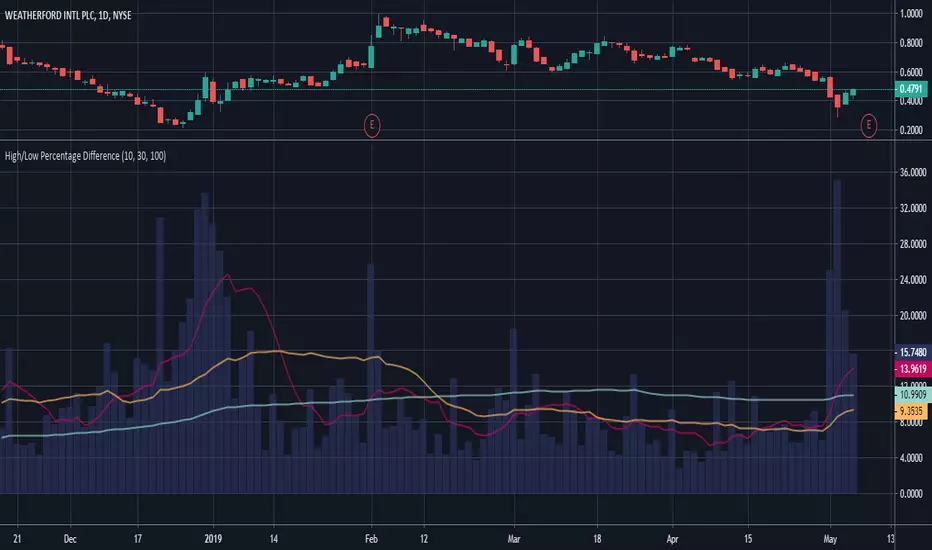
This chart shows simple moving averages of the differences in the high and low prices across the time frame you choose.
I use this when researching to see if the investment vehicle meets my criteria for volatility within the time-frame I want to invest.
The columns show the percentage difference between the current candle's high and low.
The lines show the SMA of the past 10(red), 30(orange), and 100(blue) candles, but you can edit these to be whatever you'd like.
Script protégé
Ce script est publié en source fermée. Cependant, vous pouvez l'utiliser librement et sans aucune restriction – pour en savoir plus, cliquez ici.
Clause de non-responsabilité
Les informations et publications ne sont pas destinées à être, et ne constituent pas, des conseils ou recommandations financiers, d'investissement, de trading ou autres fournis ou approuvés par TradingView. Pour en savoir plus, consultez les Conditions d'utilisation.