OPEN-SOURCE SCRIPT
Mis à jour Naked - Daily Weekly Monthly
User request for Naked Daily Weekly Monthly Opens.
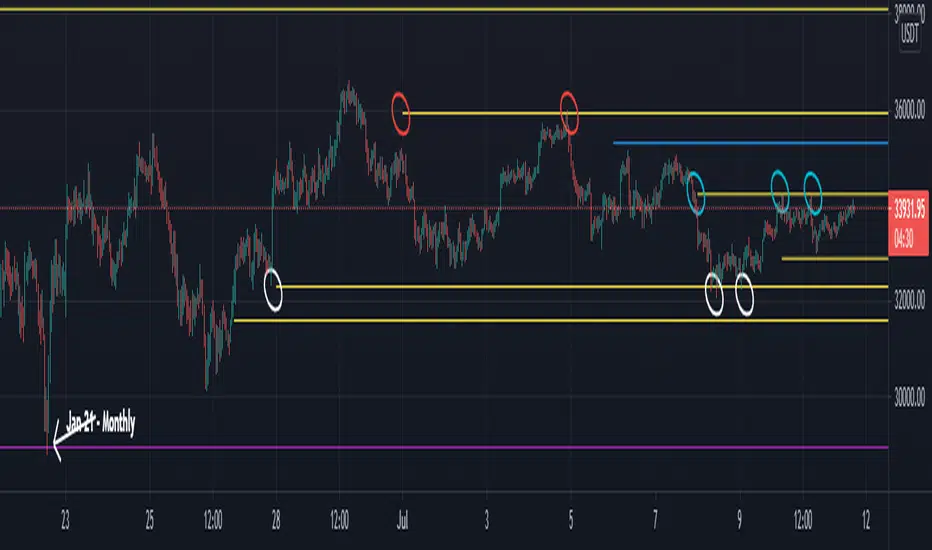
This indicator plots the Daily Weekly Opens (the day after day after creation), they then will stay on the chart until a candle close is completed on the other side of the plot.
In the above chart picture you can see how previous monthly and daily opens have acted as support and resistance.
Thanks go to:
StackOverFlow Bjorn Mistiaen
Notes de version
Disclaimer This indicator works on the daily timeframe and below.
To pick up all naked lines move the chart back in time and then back to current price action.
Notes de version
Update:User request for different line style options.
User can now change the line style from solid to dashed or dotted.
Notes de version
Error highlighted by user in comments. Code updated to resolve issue.
Notes de version
Script update:The script will now show totally Naked and Partially Naked Daily / Weekly / Monthly opens.
When looking back a previous price action keeping the partially Naked Opens as an option looks like a promising level for Technical Analysis.
Totally Naked = No price action breaks the level.
Partially Naked = Either the close or the open candles (Timeframe dependent) has not occurred below or above the level (dependent on Price Action to the level above or below).
Script open-source
Dans l'esprit TradingView, le créateur de ce script l'a rendu open source afin que les traders puissent examiner et vérifier ses fonctionnalités. Bravo à l'auteur! Bien que vous puissiez l'utiliser gratuitement, n'oubliez pas que la republication du code est soumise à nos Règles.
Clause de non-responsabilité
Les informations et publications ne sont pas destinées à être, et ne constituent pas, des conseils ou recommandations financiers, d'investissement, de trading ou autres fournis ou approuvés par TradingView. Pour en savoir plus, consultez les Conditions d'utilisation.