SFC Smart Money Manipulation - Time, Advanced Market Structure
Markets moves in cycles and swings. The indicator will help to determine these cycles and swings by time and price. These are the two columns of the market understanding. The third one is volume/ momentum, but it will not be discussed here.
Advanced Market Structure
According to ICT and Larry Williams Market Structure is not only Highs and Lows.
They present more advanced understanding of the MS:
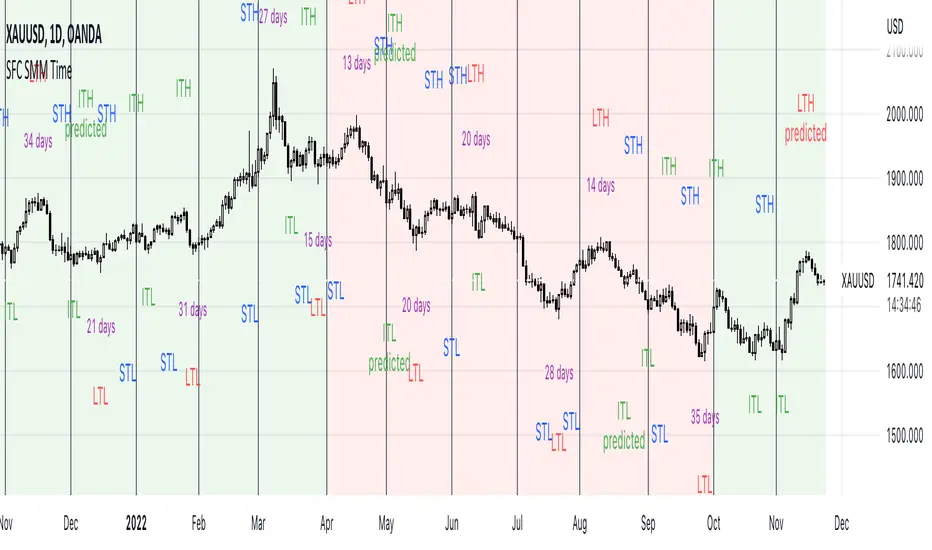
-Short Term Highs/ Lows
-Intermediate Term Highs/ Lows
-Long Term Highs/ Lows
Rules of how to determine the Swing Points according to Larry Williams:
"A market has made a short-term low when we have a day (or bar if you are using different time periods) that has a higher low on both sides. By the same token a short-term high will be a day (or bar) that has lower bars on both sides of it."
"A short-term high with lower short-term highs on both sides is an intermediate- term high. By the same token, a short-term low with higher short-term lows on both sides is an intermediate-term low."
"An intermediate-term high with lower intermediate-term highs on both sides of it is just naturally a long-term high by our definition, thanks to understanding market structure.
An intermediate-term low with higher intermediate-term lows on both sides of it is just naturally a long-term low by our definition, thanks to understanding market structure."
If the Highs and Lows are labeled properly there is high probability to predict the next High or Low. In this way the trader will know how the current trend is changing and what kind of retracement is coming - deep or shallow.
Timing
Market moves in time cycles.
There is a theory that the swings are equal by time and length. This is not always the case, but very very often.
Indicator time features:
- Swing Trading days - how many time market needed to form a swing. Only Long term(main) Swings are measured. This will help trader to label T-formations.
" T Formations is cyclically related for formations that can be drawn to project the time frame of likely turning points. Basically T-formations are based on the concept that the time distance between the starting low/high of the cyclical wave and its peak is likely to be subsequently repeated between that peak and the final low/high of that cycle."
- Seasonality - theoretically an asset should go up or down in particular yearly quarter. Practically the direction not always match to quarters. Thats why the indicator shows the theoretical seasonal direction and historical real direction.
Seasonal direction is automatically displayed or XAUUSD, XAGUSD, EURUSD, AUDUSD, GBPUSD. There is a ways to set the seasonality manually.
- Earnings Season - This time is very important for Stocks and Indices. Most of the time the assets are in bullish trend during the Earnings Seasons.
- Monthly separator - Shows the monthly time cycle
- Gold bullish months - There are studies on Gold market. They shows that Gold is very bullish in particular months. These are displayed.
The indicator works only on Daily Time Frame.
Script sur invitation seulement
Seuls les utilisateurs approuvés par l'auteur peuvent accéder à ce script. Vous devrez demander et obtenir l'autorisation pour l'utiliser. Celle-ci est généralement accordée après paiement. Pour plus de détails, suivez les instructions de l'auteur ci-dessous ou contactez directement SerpentForexClub.
TradingView ne recommande PAS d'acheter ou d'utiliser un script à moins que vous ne fassiez entièrement confiance à son auteur et que vous compreniez son fonctionnement. Vous pouvez également trouver des alternatives gratuites et open source dans nos scripts communautaires.
Instructions de l'auteur
Clause de non-responsabilité
Script sur invitation seulement
Seuls les utilisateurs approuvés par l'auteur peuvent accéder à ce script. Vous devrez demander et obtenir l'autorisation pour l'utiliser. Celle-ci est généralement accordée après paiement. Pour plus de détails, suivez les instructions de l'auteur ci-dessous ou contactez directement SerpentForexClub.
TradingView ne recommande PAS d'acheter ou d'utiliser un script à moins que vous ne fassiez entièrement confiance à son auteur et que vous compreniez son fonctionnement. Vous pouvez également trouver des alternatives gratuites et open source dans nos scripts communautaires.