This project is about:
- VPSV
- array.new_line()
- array.new_box()
VPSV (pine) is one of the rare features that draws lines/figures BETWEEN bars

It doesn't run on Pine script, which makes it possible to do such things.
I wanted to have something similar while a restriction of Pine script is the impossibility to draw between bars, the only way I could think of is by using line width

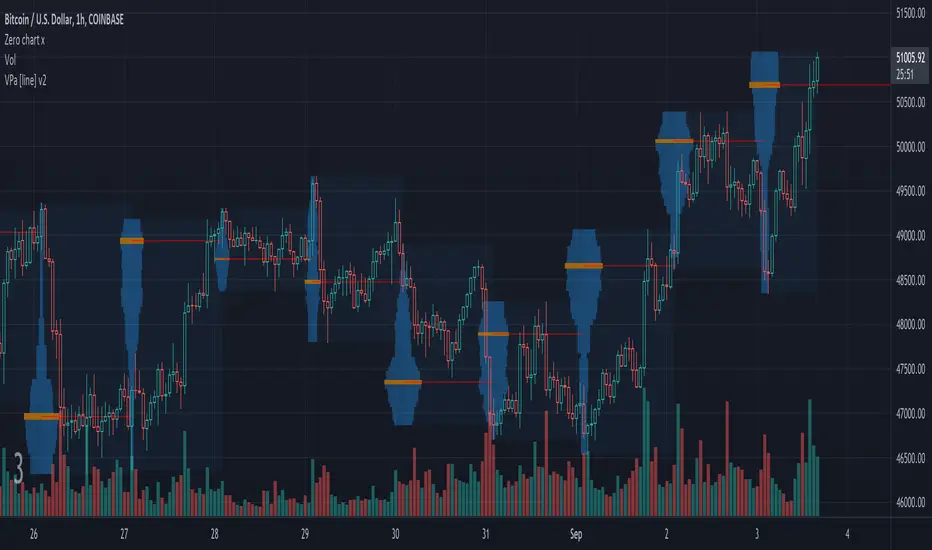
In this script the higher timeframe is started with several lines (left) and a box, this box goes further until the higher timeframe ends.
During the creation of the box, each candle (lower timeframe) in this box (higher timeframe - period) is checked for position and volume, the volume is added to the left line, so when you see a thicker line, this means at that level there is more volume traded.
One of the big differences with other volume profiles is that many look back to a previous period, here when a period starts, the lines collect data - volume until the period ends, it is especially very visible in very low TF's (seconds)
This is my first script with array.new_line() - array.new_box(), which is a very nice Pine feature!
I hope this script can be helpful to see the possibilities
Settings:
'Parts' -> amount of lines (left of box)
5 Parts:

15 Parts:

25 Parts:

50 Parts:

'Max Width' -> Sets the max width of the lines
'Automatic Settings' -> Sets the higher time frame automatically, see the tooltip ⓘ for more info
The yellow line is the max volume line of that period, last period has a red line (POC), also referring the max.
Cheers!
- VPSV
- array.new_line()
- array.new_box()
VPSV (pine) is one of the rare features that draws lines/figures BETWEEN bars
It doesn't run on Pine script, which makes it possible to do such things.
I wanted to have something similar while a restriction of Pine script is the impossibility to draw between bars, the only way I could think of is by using line width
In this script the higher timeframe is started with several lines (left) and a box, this box goes further until the higher timeframe ends.
During the creation of the box, each candle (lower timeframe) in this box (higher timeframe - period) is checked for position and volume, the volume is added to the left line, so when you see a thicker line, this means at that level there is more volume traded.
One of the big differences with other volume profiles is that many look back to a previous period, here when a period starts, the lines collect data - volume until the period ends, it is especially very visible in very low TF's (seconds)
This is my first script with array.new_line() - array.new_box(), which is a very nice Pine feature!
I hope this script can be helpful to see the possibilities
Settings:
'Parts' -> amount of lines (left of box)
5 Parts:
15 Parts:
25 Parts:
50 Parts:
'Max Width' -> Sets the max width of the lines
'Automatic Settings' -> Sets the higher time frame automatically, see the tooltip ⓘ for more info
The yellow line is the max volume line of that period, last period has a red line (POC), also referring the max.
Cheers!
Notes de version
bugfixNotes de version
Improvement of array clean-up (Thanks HeWhoMustNotBeNamed !)Notes de version
Added more POC linesNotes de version
• Added 'Visible Barcolor' for users who use "Bars" as "Bar's Style", default off• Converted to v5
Notes de version
• Added 'Visible Barcolor' for users who use "Bars" as "Bar's Style", default off• Converted to v5
Script open-source
Dans l'esprit TradingView, le créateur de ce script l'a rendu open source afin que les traders puissent examiner et vérifier ses fonctionnalités. Bravo à l'auteur! Bien que vous puissiez l'utiliser gratuitement, n'oubliez pas que la republication du code est soumise à nos Règles.
Who are PineCoders?
tradingview.com/chart/SSP/yW5eOqtm-Who-are-PineCoders/
TG Pine Script® Q&A: t.me/PineCodersQA
- We cannot control our emotions,
but we can control our keyboard -
tradingview.com/chart/SSP/yW5eOqtm-Who-are-PineCoders/
TG Pine Script® Q&A: t.me/PineCodersQA
- We cannot control our emotions,
but we can control our keyboard -
Clause de non-responsabilité
Les informations et publications ne sont pas destinées à être, et ne constituent pas, des conseils ou recommandations financiers, d'investissement, de trading ou autres fournis ou approuvés par TradingView. Pour en savoir plus, consultez les Conditions d'utilisation.