INVITE-ONLY SCRIPT
Crack_RACD_Divergence_Ver_1.0.1
Hello my dear traders. This is Tommy.
This time our team spent so much time and effort developing a technical indicator that catches the trend reversal signal relatively earlier than any other existing indicators.
Two RSIs (which quantify the relative strength of the price momentum using closed price of a candle) with certain parameters that we have found were exponentially smoothed using our very own equations.
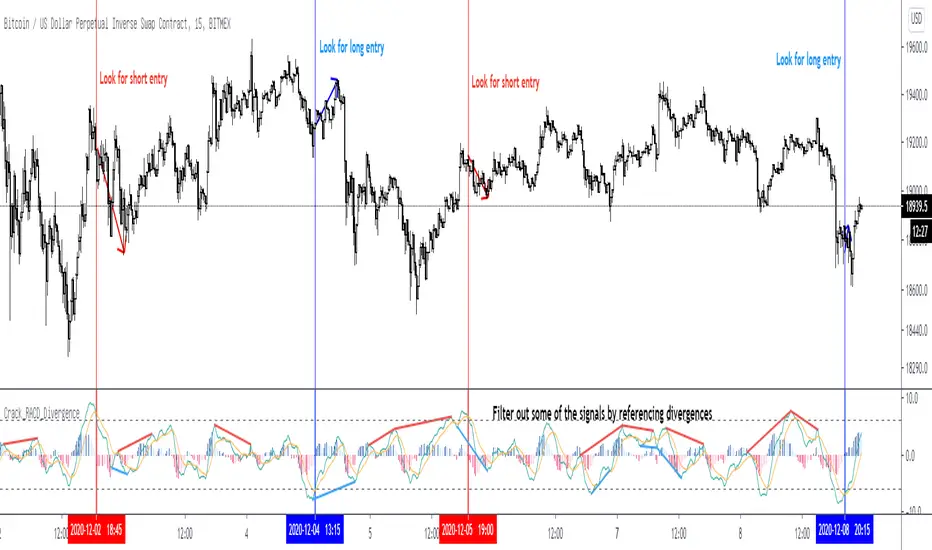
We have programmed it to be signaled when golden and death crosses appear above and below certain area that we have concluded it as an overbought and oversold zone.
Similar to MACD (Moving Average Convergence Divergence) trading strategy, the histogram represents the distance between two RSIs.
When the histograms are trending towards the centerline, this means that the RSIs are converging and vice versa when histograms are going away from the centerline.
Moreover, when this logic confirms swing highs/lows using highs and lows of the candles (instead of closed), it automatically shows both the bullish and bearish divergences.
Thank you.
안녕하세요 트레이더 여러분. 토미입니다.
최근에 저희가 연구 및 개발한 지표는 단기와 중기 추세를 반영하는 두개의 선(RSI를 특정 로직으로 exponentially smoothed한)의 크로스오버가 저희가 정한 과매수/과매도 구간에서 발생할 시 변곡으로 해석해서 시그널을 주는 괴물 같은 녀석입니다.
히스토그램은 MACD 지표 비슷하게 두 선의 이격도를 나타냅니다. 센터라인으로 방향으로 히스토그램이 줄어들면 두 선의 차이가 줄어들고 있는 뜻이고, 히스토그램이 음/양의 방향으로 더 높아지면 두 선의 차이가 늘어나고 있는 뜻입니다.
게다가 자동으로 다이버전스도 잡아줍니다.
지표 사용을 원하시는 분들은 저희 채널에 문의 주시면 됩니다~
감사합니다.
This time our team spent so much time and effort developing a technical indicator that catches the trend reversal signal relatively earlier than any other existing indicators.
Two RSIs (which quantify the relative strength of the price momentum using closed price of a candle) with certain parameters that we have found were exponentially smoothed using our very own equations.
We have programmed it to be signaled when golden and death crosses appear above and below certain area that we have concluded it as an overbought and oversold zone.
Similar to MACD (Moving Average Convergence Divergence) trading strategy, the histogram represents the distance between two RSIs.
When the histograms are trending towards the centerline, this means that the RSIs are converging and vice versa when histograms are going away from the centerline.
Moreover, when this logic confirms swing highs/lows using highs and lows of the candles (instead of closed), it automatically shows both the bullish and bearish divergences.
Thank you.
안녕하세요 트레이더 여러분. 토미입니다.
최근에 저희가 연구 및 개발한 지표는 단기와 중기 추세를 반영하는 두개의 선(RSI를 특정 로직으로 exponentially smoothed한)의 크로스오버가 저희가 정한 과매수/과매도 구간에서 발생할 시 변곡으로 해석해서 시그널을 주는 괴물 같은 녀석입니다.
히스토그램은 MACD 지표 비슷하게 두 선의 이격도를 나타냅니다. 센터라인으로 방향으로 히스토그램이 줄어들면 두 선의 차이가 줄어들고 있는 뜻이고, 히스토그램이 음/양의 방향으로 더 높아지면 두 선의 차이가 늘어나고 있는 뜻입니다.
게다가 자동으로 다이버전스도 잡아줍니다.
지표 사용을 원하시는 분들은 저희 채널에 문의 주시면 됩니다~
감사합니다.
Script sur invitation seulement
L'accès à ce script est limité aux utilisateurs autorisés par l'auteur et nécessite généralement un paiement. Vous pouvez l'ajouter à vos favoris, mais vous ne pourrez l'utiliser qu'après avoir demandé et obtenu l'autorisation de son auteur. Contactez Tommy_Trader pour plus d'informations, ou suivez les instructions de l'auteur ci-dessous.
TradingView ne suggère pas de payer pour un script et de l'utiliser à moins que vous ne fassiez confiance à 100% à son auteur et que vous compreniez comment le script fonctionne. Dans de nombreux cas, vous pouvez trouver une bonne alternative open-source gratuite dans nos Scripts communautaires.
Instructions de l'auteur
″
Vous voulez utiliser ce script sur un graphique ?
Avertissement: veuillez lire avant de demander l'accès.
토미 라이브 차트 보기: litt.ly/tommytradingtv
Youtube: bit.ly/Tommy_TV
Telegram: bit.ly/Tommy_Main
트레이딩 MBTI 테스트하기: tradingmbti.waveon.io/
Youtube: bit.ly/Tommy_TV
Telegram: bit.ly/Tommy_Main
트레이딩 MBTI 테스트하기: tradingmbti.waveon.io/
Clause de non-responsabilité
Les informations et les publications ne sont pas destinées à être, et ne constituent pas, des conseils ou des recommandations en matière de finance, d'investissement, de trading ou d'autres types de conseils fournis ou approuvés par TradingView. Pour en savoir plus, consultez les Conditions d'utilisation.