PROTECTED SOURCE SCRIPT
Mis à jour BULB 20
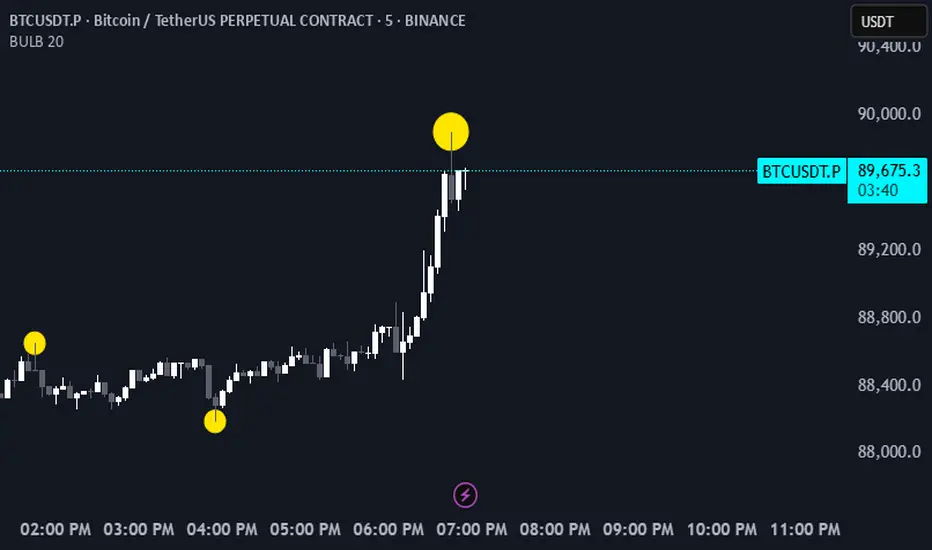
Fractal Wave Marker Indicator
The Fractal Wave Marker is a technical analysis tool designed to visually highlight significant turning points in price action, offering clear signals of potential market reversals. By detecting fractal-like patterns, the indicator identifies high and low points within a specified period, helping traders pinpoint key market swings.
Key Features:
Fixed Period: The period is set to .., ensuring consistency in detecting turning points based on historical price data.
Swing Detection: The indicator detects both base (lower-degree) and fractal (higher-degree) swings, helping to visualize both short-term and long-term trend changes.
Color-coded Markers: High points are marked with a custom color to indicate bullish conditions, while low points are marked in another color for bearish conditions.
Wave Processing: The indicator processes swing highs and lows, dynamically updating to reflect the most relevant turning points on the chart.
Overlay on Chart: Markers are overlaid directly on the chart for quick, intuitive insights into price action, helping traders make better entry and exit decisions.
How It Works:
The indicator calculates the highest highs and lowest lows over a -bar period (fixed period).
When a new swing point is detected, the indicator marks it with a circle, color-coded based on whether it’s a high or low point.
The base swing and fractal wave directions are updated with each new turning point, allowing traders to follow price action and identify market trends.
Notes de version
Fractal Wave Marker IndicatorThe Fractal Wave Marker is a technical analysis tool designed to visually highlight significant turning points in price action, offering clear signals of potential market reversals. By detecting fractal-like patterns, the indicator identifies high and low points within a specified period, helping traders pinpoint key market swings.
Key Features:
Fixed Period: The period is set to .., ensuring consistency in detecting turning points based on historical price data.
Swing Detection: The indicator detects both base (lower-degree) and fractal (higher-degree) swings, helping to visualize both short-term and long-term trend changes.
Color-coded Markers: High points are marked with a custom color to indicate bullish conditions, while low points are marked in another color for bearish conditions.
Wave Processing: The indicator processes swing highs and lows, dynamically updating to reflect the most relevant turning points on the chart.
Overlay on Chart: Markers are overlaid directly on the chart for quick, intuitive insights into price action, helping traders make better entry and exit decisions.
How It Works:
The indicator calculates the highest highs and lowest lows over a -bar period (fixed period).
When a new swing point is detected, the indicator marks it with a circle, color-coded based on whether it’s a high or low point.
The base swing and fractal wave directions are updated with each new turning point, allowing traders to follow price action and identify market trends.
Script protégé
Ce script est publié en source fermée. Toutefois, vous pouvez l'utiliser librement et sans aucune restriction - en savoir plus ici.
Clause de non-responsabilité
Les informations et les publications ne sont pas destinées à être, et ne constituent pas, des conseils ou des recommandations en matière de finance, d'investissement, de trading ou d'autres types de conseils fournis ou approuvés par TradingView. Pour en savoir plus, consultez les Conditions d'utilisation.