OPEN-SOURCE SCRIPT
MSRanges
📖 Market Structure with Ranges —
What this script does
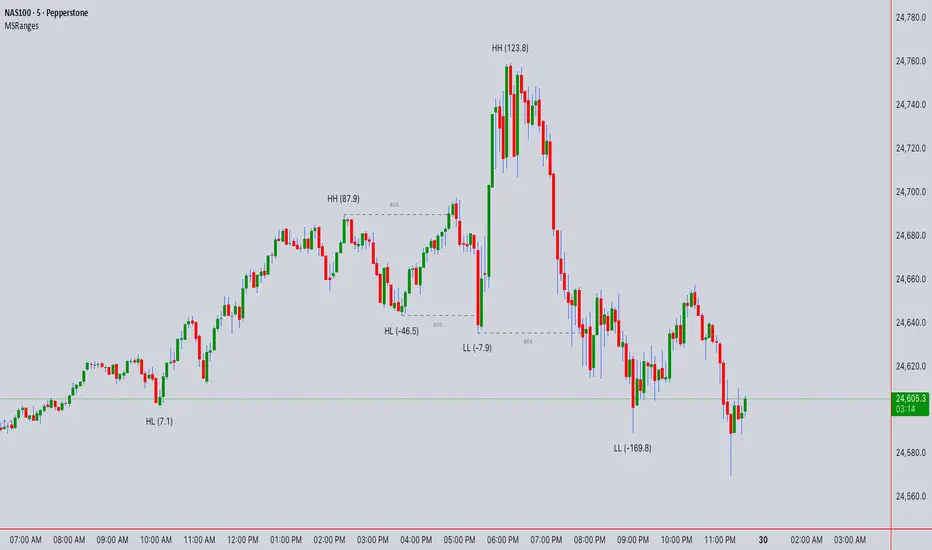
This indicator highlights market structure on any symbol or timeframe. It automatically marks:
Swing points: Higher High (HH), Lower High (LH), Higher Low (HL), Lower Low (LL).
Break of Structure (BOS) and optional Change of Character (CHoCH) events.
Price ranges: each new swing label shows the difference from the last swing in price units (e.g. HH (54.8) or LL (-169.5)).
This lets you see at a glance whether the market is trending, consolidating, or shifting character.
How it works
Range calculation
Inputs & customization
How to use in practice
Trend identification:
Breakout confirmation:
Reversal watch:
Range analysis:
Best practices
Technical notes
Disclaimer
This script is for educational purposes only. It is not financial advice and should not be used as a sole basis for trading decisions. Past performance of any method or indicator does not guarantee future results. Always test on demo accounts and apply proper risk management.
What this script does
This indicator highlights market structure on any symbol or timeframe. It automatically marks:
Swing points: Higher High (HH), Lower High (LH), Higher Low (HL), Lower Low (LL).
Break of Structure (BOS) and optional Change of Character (CHoCH) events.
Price ranges: each new swing label shows the difference from the last swing in price units (e.g. HH (54.8) or LL (-169.5)).
This lets you see at a glance whether the market is trending, consolidating, or shifting character.
How it works
- Pivot detection
Uses TradingView’s ta.pivothigh / ta.pivotlow with a user-set Swing Length.
A pivot is confirmed only after the right-hand bars pass, so labels appear with a delay equal to Swing Length.
- Swing classification
Each new pivot is compared with the previous pivot:
If a new high is higher than the last → HH.
If a new high is lower → LH.
If a new low is higher → HL.
If a new low is lower → LL.
- Break of Structure (BOS)
A BOS is drawn when price closes (or wicks, depending on settings) beyond a previous swing.
The first BOS against trend can optionally be labelled CHoCH.
Range calculation
When a new swing is confirmed, the script prints the difference between that pivot and the previous swing.
Example: HL at 24,600 → HH at 24,655 → label shows HH (55).
Inputs & customization
Swing Length: bars left/right used to confirm pivots. Larger = fewer, more reliable swings; smaller = more signals, more noise.
BOS Confirmation: choose whether a BOS requires a full candle close or just a wick beyond the level.
Show CHoCH: toggle whether the first countertrend BOS is renamed CHoCH.
Show Swing Points: show/hide HH / LH / HL / LL labels.
BOS Style Settings: customize color, line style, and width.
How to use in practice
Trend identification:
Uptrend → repeating HL → HH sequence.
Downtrend → repeating LH → LL.
Breakout confirmation:
- A BOS confirms continuation. Retests of BOS lines often act as support/resistance.
Reversal watch:
- A CHoCH can signal possible trend shift. Wait for confirmation from price action or higher timeframe structure.
Range analysis:
- The range numbers help compare move sizes. If swings shrink, market may be consolidating; if they expand, volatility is rising.
Best practices
- Combine with higher timeframe analysis: use HTF trend, then refine entries on LTF.
- Always confirm with other tools (volume, RSI, order flow) before trading.
- Adjust Swing Length for the symbol and timeframe you trade.
- Use risk management — never rely on a single indicator.
Technical notes
- Pivots are not predictive — they appear only after confirmation. This avoids repainting but introduces lag.
- Many labels/lines can impact chart performance; the script sets sensible max_labels_count and max_lines_count.
- Designed for clarity, not signals. It does not issue buy/sell calls.
Disclaimer
This script is for educational purposes only. It is not financial advice and should not be used as a sole basis for trading decisions. Past performance of any method or indicator does not guarantee future results. Always test on demo accounts and apply proper risk management.
Script open-source
Dans l'esprit de TradingView, le créateur de ce script l'a rendu open-source, afin que les traders puissent examiner et vérifier sa fonctionnalité. Bravo à l'auteur! Vous pouvez l'utiliser gratuitement, mais n'oubliez pas que la republication du code est soumise à nos Règles.
I am nothing @shunya.trade
Clause de non-responsabilité
Les informations et les publications ne sont pas destinées à être, et ne constituent pas, des conseils ou des recommandations en matière de finance, d'investissement, de trading ou d'autres types de conseils fournis ou approuvés par TradingView. Pour en savoir plus, consultez les Conditions d'utilisation.