PROTECTED SOURCE SCRIPT
Mis à jour MTF Stochastic Dashboard
What you see:
Settings
Signal mode:
Quick presets
Settings
Signal mode:
Quick presets
Notes de version
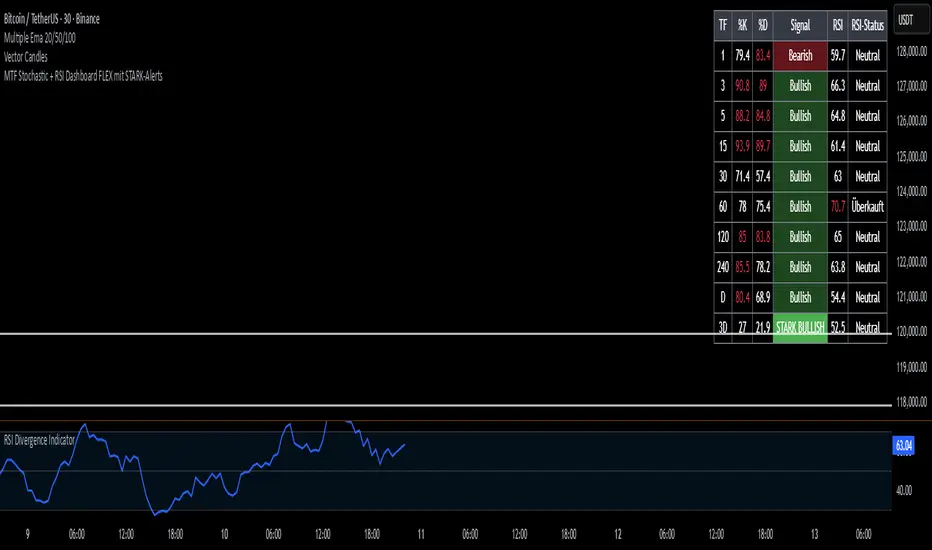
This Pine Script v6 creates a multi-timeframe dashboard that shows Stochastic (%K, %D) and RSI values across 1m–3D.Cells turn red/green when overbought/oversold.
A signal column shows Bullish / Bearish conditions based on gap/cross logic.
An extra column displays the RSI status (Overbought / Oversold / Neutral).
Would you like me to also rename headers and labels to English inside the code so the table matches this description?
Notes de version
This Pine Script is a Multi-Timeframe Stochastic + RSI Dashboard with fully customizable alerts.It shows %K, %D, RSI values, and signal status for multiple timeframes in a table.
Signals are classified as Bullish / Bearish and Strong Bullish / Strong Bearish based on adjustable thresholds.
Colors for signals can be customized in the Style tab.
You can choose which timeframes to display and which ones should trigger alerts.
Alerts only fire on Strong signals, with optional RSI confirmation.
Script protégé
Ce script est publié en source fermée. Cependant, vous pouvez l'utiliser librement et sans aucune restriction – pour en savoir plus, cliquez ici.
Clause de non-responsabilité
Les informations et publications ne sont pas destinées à être, et ne constituent pas, des conseils ou recommandations financiers, d'investissement, de trading ou autres fournis ou approuvés par TradingView. Pour en savoir plus, consultez les Conditions d'utilisation.