OPEN-SOURCE SCRIPT
SDSpike
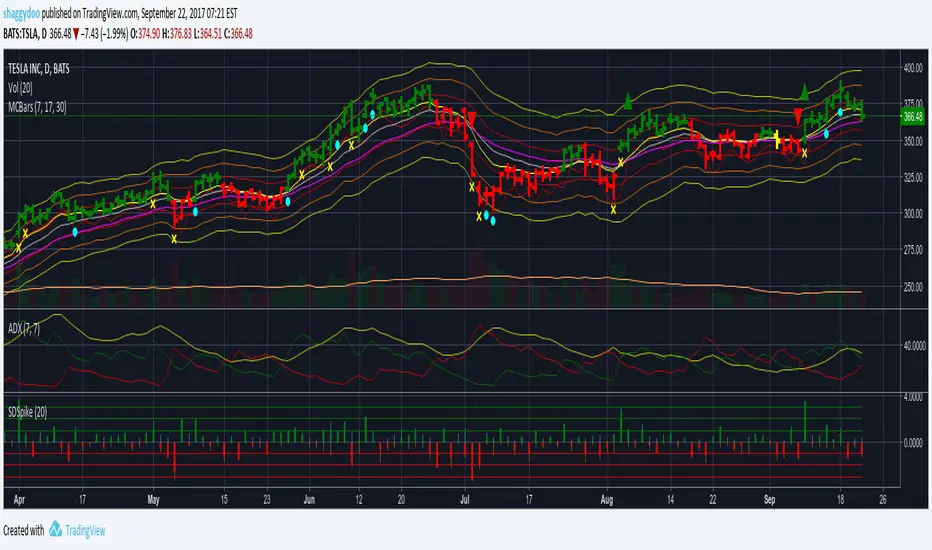
Price Change as Standard Deviation Spikes
Plots price changes scaled to daily StdDev for the period
The Close price change is plotted as a thick bar coloured green for up close, red for down close
The High price change is plotted as a thin bar coloured aqua
The Low price change is plotted as a thin bar coloured orange
Can be used to understand the statistical price behaviour of the symbol.
Very useful for earnings trades and in general for options trades.
Script open-source
Dans l'esprit TradingView, le créateur de ce script l'a rendu open source afin que les traders puissent examiner et vérifier ses fonctionnalités. Bravo à l'auteur! Bien que vous puissiez l'utiliser gratuitement, n'oubliez pas que la republication du code est soumise à nos Règles.
Clause de non-responsabilité
Les informations et publications ne sont pas destinées à être, et ne constituent pas, des conseils ou recommandations financiers, d'investissement, de trading ou autres fournis ou approuvés par TradingView. Pour en savoir plus, consultez les Conditions d'utilisation.