OPEN-SOURCE SCRIPT
FIB vs HL
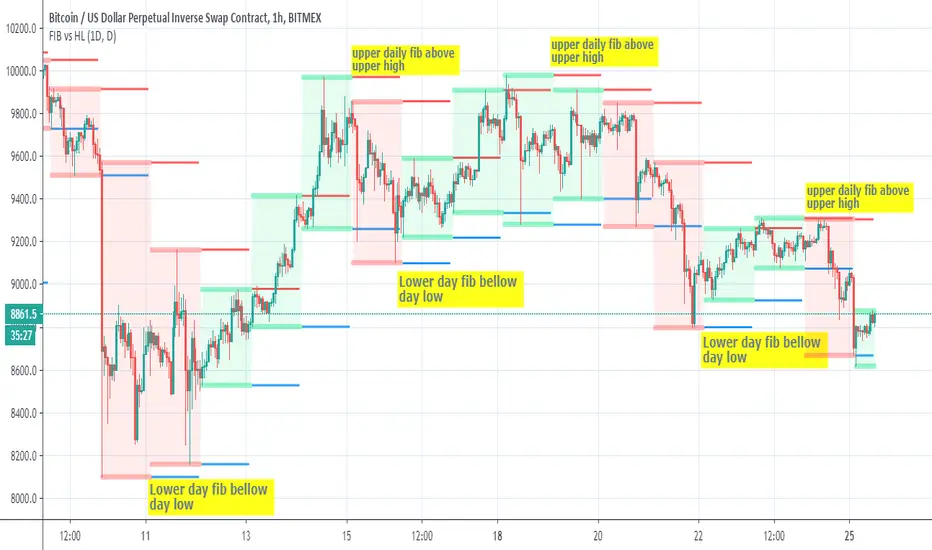
This script show the relation bettwen daily fib seen in red =upper and blue=lower to daily candles upper and lower
since there is slight variation how both calculated we can see that when daily fib is lower then the low candles daily low then there is a good chance for a buy trend
and vice versa in oposite direction
so it just a nice idea that need further verification
since there is slight variation how both calculated we can see that when daily fib is lower then the low candles daily low then there is a good chance for a buy trend
and vice versa in oposite direction
so it just a nice idea that need further verification
Script open-source
Dans l'esprit TradingView, le créateur de ce script l'a rendu open source afin que les traders puissent examiner et vérifier ses fonctionnalités. Bravo à l'auteur! Bien que vous puissiez l'utiliser gratuitement, n'oubliez pas que la republication du code est soumise à nos Règles.
Clause de non-responsabilité
Les informations et publications ne sont pas destinées à être, et ne constituent pas, des conseils ou recommandations financiers, d'investissement, de trading ou autres fournis ou approuvés par TradingView. Pour en savoir plus, consultez les Conditions d'utilisation.