PROTECTED SOURCE SCRIPT
Mis à jour Market Balance
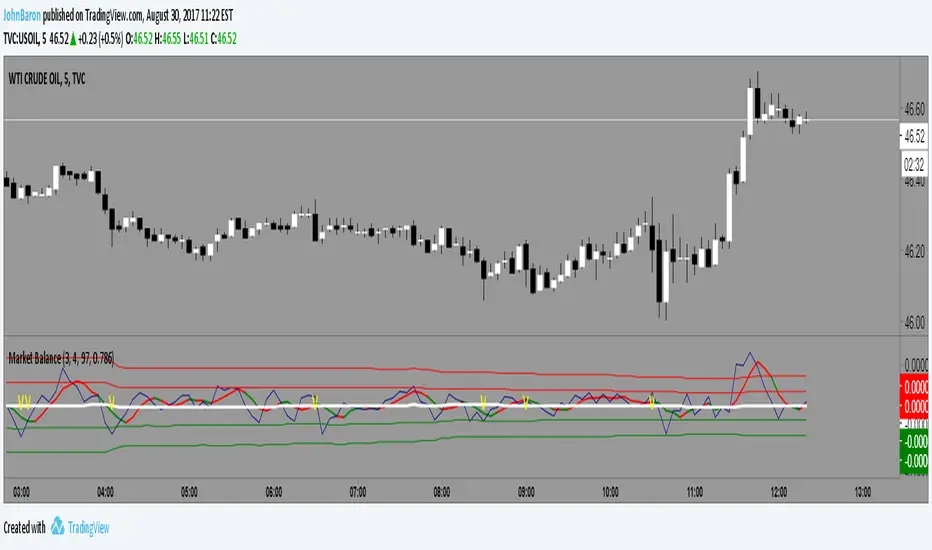
This indicator simply tracks the balance of the supply/demand and will always revert to the mean.
If the market is over bought it will move above the mean, hit a limit and come back toward the mean. Opposite for oversold.
The difference between this and MFI or RSI is that a market can move up or down in an organized fashion and stay close to the mean. It is impulsive moves up or down that will correct.
So a trader might be able to gauge whether an given stock has the likelihood to pullback or bounce based on this indicator.
The color indicator attempts to predict the color of the next bar.
Works well with Heiken Ashi style candles as well.
Notes de version
Added .. balance zoneNotes de version
Some small aesthetics.Note, the color indicator on the moving average is a prediction of the next bar color.
Script protégé
Ce script est publié en source fermée. Cependant, vous pouvez l'utiliser librement et sans aucune restriction – pour en savoir plus, cliquez ici.
Clause de non-responsabilité
Les informations et publications ne sont pas destinées à être, et ne constituent pas, des conseils ou recommandations financiers, d'investissement, de trading ou autres fournis ou approuvés par TradingView. Pour en savoir plus, consultez les Conditions d'utilisation.