OPEN-SOURCE SCRIPT
RSI Curl Signals 70 / 60 / 40
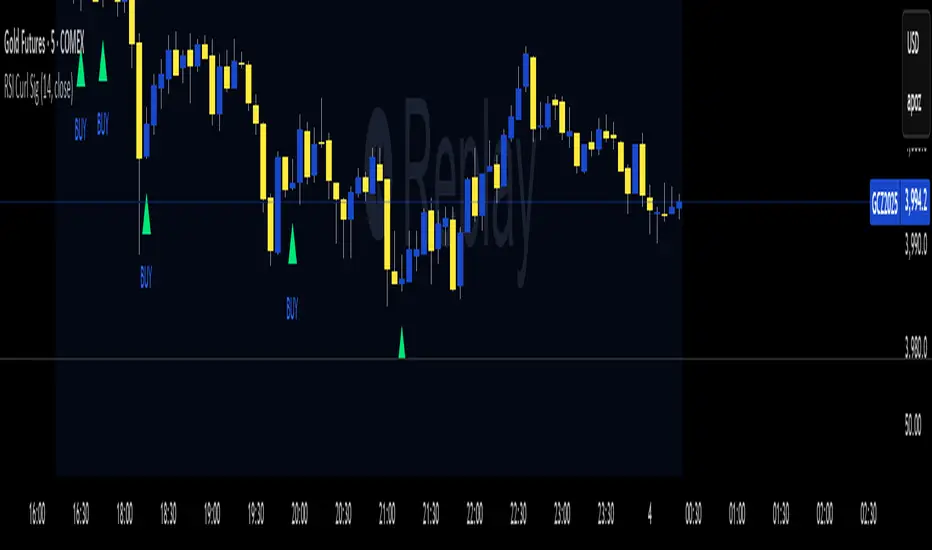
This Indicator Identifies the turning points on the RSI and plots a buy and sell signal on the chart It plots on crossing up above the 41 Level on the RSI and plots a sell curling below the 60 level use a standard RSI on chart if needed with alerts set at RSI curling up above value 40 Level and use an alert for curling below Level 60 use support and resistance for confirmation
Works with any timeframe Ans any asset
Works with any timeframe Ans any asset
Script open-source
Dans l'esprit de TradingView, le créateur de ce script l'a rendu open-source, afin que les traders puissent examiner et vérifier sa fonctionnalité. Bravo à l'auteur! Vous pouvez l'utiliser gratuitement, mais n'oubliez pas que la republication du code est soumise à nos Règles.
Clause de non-responsabilité
Les informations et les publications ne sont pas destinées à être, et ne constituent pas, des conseils ou des recommandations en matière de finance, d'investissement, de trading ou d'autres types de conseils fournis ou approuvés par TradingView. Pour en savoir plus, consultez les Conditions d'utilisation.