OPEN-SOURCE SCRIPT
Mis à jour Renko Chart Emulation

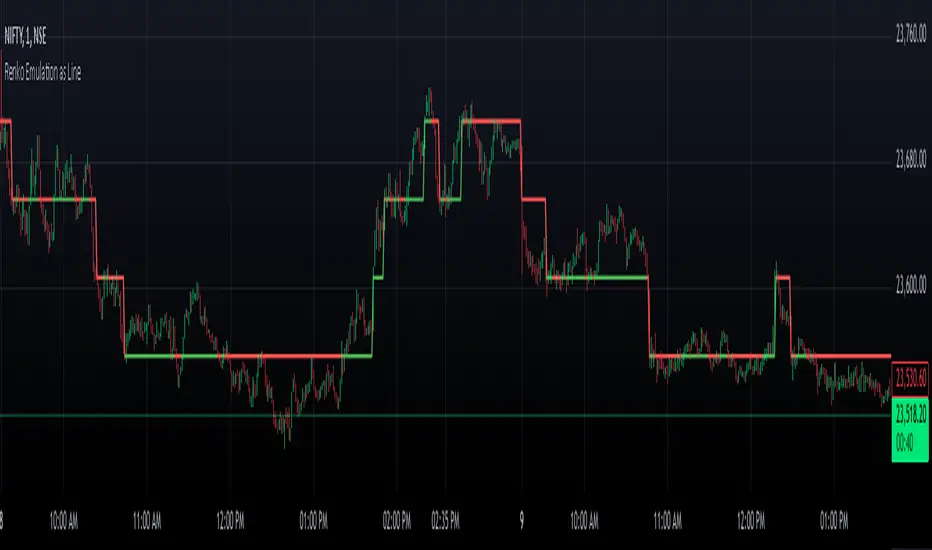
Renko charts are a popular tool in technical analysis, known for their ability to filter out market noise and focus purely on price movements. Unlike traditional candlestick or bar charts, Renko charts are not time-based but are constructed using bricks that represent a fixed price movement. This makes them particularly useful for identifying trends and key levels of support and resistance. While Renko charts are commonly found on platforms with specialized charting capabilities, they can also be emulated in Pine Script as a line indicator.
The Renko emulation indicator in Pine Script calculates the movement of price based on a user-defined brick size. Whenever the price moves up or down by an amount equal to or greater than the brick size, a new level is plotted, indicating a shift in price direction. This approach helps traders visualize significant price moves without the distractions of smaller fluctuations. By plotting the Renko levels as a continuous line and coloring it based on direction, this indicator provides a clean and straightforward representation of market trends.
Traders can use this Renko emulation line to identify potential entry and exit points, as well as to confirm ongoing trends. The simplicity of Renko charts makes them a favorite among those who prefer a minimalist approach to technical analysis. However, it is essential to choose an appropriate brick size that aligns with the volatility of the trading instrument. A smaller brick size may result in frequent signals, while a larger one can smooth out the chart, focusing only on the most substantial price movements. This script offers a flexible solution for incorporating Renko-style analysis into any trading strategy.
Notes de version
Overlay fixedScript open-source
Dans l'esprit TradingView, le créateur de ce script l'a rendu open source afin que les traders puissent examiner et vérifier ses fonctionnalités. Bravo à l'auteur! Bien que vous puissiez l'utiliser gratuitement, n'oubliez pas que la republication du code est soumise à nos Règles.
Clause de non-responsabilité
Les informations et publications ne sont pas destinées à être, et ne constituent pas, des conseils ou recommandations financiers, d'investissement, de trading ou autres fournis ou approuvés par TradingView. Pour en savoir plus, consultez les Conditions d'utilisation.
Script open-source
Dans l'esprit TradingView, le créateur de ce script l'a rendu open source afin que les traders puissent examiner et vérifier ses fonctionnalités. Bravo à l'auteur! Bien que vous puissiez l'utiliser gratuitement, n'oubliez pas que la republication du code est soumise à nos Règles.
Clause de non-responsabilité
Les informations et publications ne sont pas destinées à être, et ne constituent pas, des conseils ou recommandations financiers, d'investissement, de trading ou autres fournis ou approuvés par TradingView. Pour en savoir plus, consultez les Conditions d'utilisation.