OPEN-SOURCE SCRIPT
Mis à jour Divergence Finder (RSI/Price) with Options
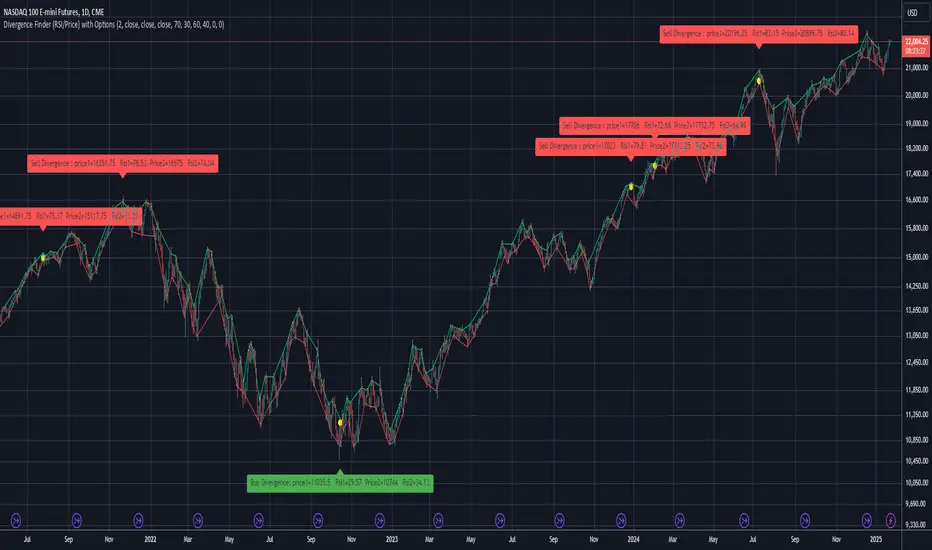
Divergence finder used to find BUY or SELL Signal based on a divergence between Price and RSI (Price goes UP when RSI goes down / opposite )
You can configure the script with several Options :
Source for Price Buy Div : you can use the close price of the candle (by default) or use the high price of the candle for exemple.
Source for Price Sell Div : you can use the close price of the candle (by default) or use the low price of the candle for exemple.
Source for RSI Div : you can use the close price of the candle (by default) to calculate the RSI .
Theses settings allow you to set a minimum RSI level to reach to activate the Divergence finder (p1 is the first point in time, and p2 is the second one):
Min RSI for Sell divergence(p1) : this is the minimum RSI level to reach for the first of the 2 points of divergence (Default 70) for the SELL Signal
Min RSI for Sell divergence (p2) : this is the minimum RSI level to reach for the second of the 2 points of divergence (Default 60) for the SELL Signal
Max RSI for Buy divergence (p1) : this is the minimum RSI level to reach for the first of the 2 points of divergence (Default 30) for the BUY Signal
Max RSI for Buy divergence (p2) : this is the minimum RSI level to reach for the second of the 2 points of divergence (Default 40 ) for the BUY Signal
Theses settings allow you to set a minimum margin difference between our two points (p1 and p2) to validate the Divergence
Min margin between price for displaying divergence (%) : Set a minimum margin (in % of the price) before the indicator validate this divergence
Min margin between RSI for displaying divergence (%) : Set a minimum margin (in % of the RSI ) before the indicator validate this divergence
Display Divergence label : Choose to display the price of the candle, and the RSI when a divergence is found
Display tops/bottoms : Display where the tops and bottoms are calculated directly on the chart
Notes de version
re-enabled MinMargin for Sell Divergence (was only used for buy divergence by mistake)Notes de version
clean the chartNotes de version
Added an Alert when divergence is detected.Notes de version
Change few settings, and added description to existing settings.Display tops and bottoms depending on source selected.
Notes de version
Display of settings changed.Notes de version
Select Divergence Between Price and RSI, or Price and OBVScript open-source
Dans l'esprit TradingView, le créateur de ce script l'a rendu open source afin que les traders puissent examiner et vérifier ses fonctionnalités. Bravo à l'auteur! Bien que vous puissiez l'utiliser gratuitement, n'oubliez pas que la republication du code est soumise à nos Règles.
Clause de non-responsabilité
Les informations et publications ne sont pas destinées à être, et ne constituent pas, des conseils ou recommandations financiers, d'investissement, de trading ou autres fournis ou approuvés par TradingView. Pour en savoir plus, consultez les Conditions d'utilisation.
Script open-source
Dans l'esprit TradingView, le créateur de ce script l'a rendu open source afin que les traders puissent examiner et vérifier ses fonctionnalités. Bravo à l'auteur! Bien que vous puissiez l'utiliser gratuitement, n'oubliez pas que la republication du code est soumise à nos Règles.
Clause de non-responsabilité
Les informations et publications ne sont pas destinées à être, et ne constituent pas, des conseils ou recommandations financiers, d'investissement, de trading ou autres fournis ou approuvés par TradingView. Pour en savoir plus, consultez les Conditions d'utilisation.