PROTECTED SOURCE SCRIPT
Arbitrage System

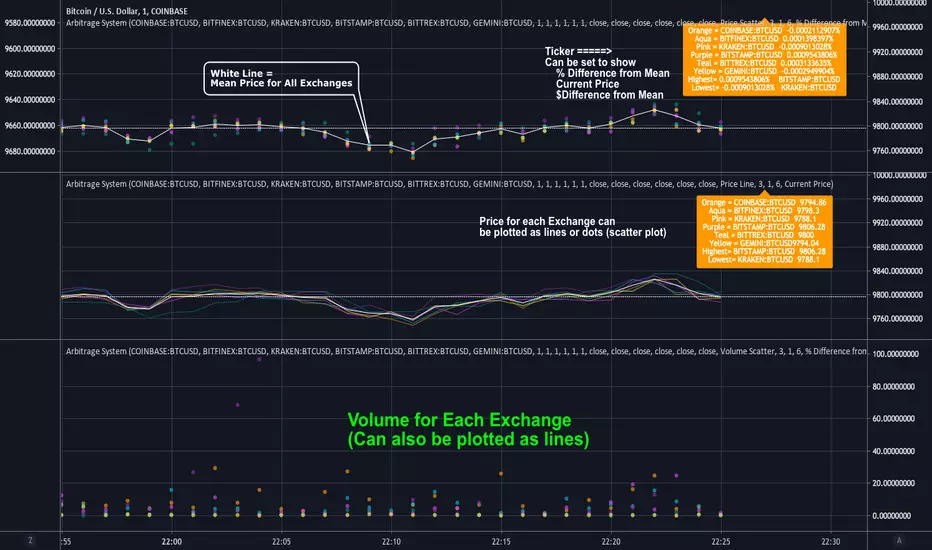
This script allows you to track the price and volume movement across 6 different exchanges. By default, it is configured for BTC and pulls price and volume data from Gemini, Bitfinex, Bittrex, Bitstamp, Coinbase and Kraken.
Users can use the input options menu to choose which exchanges or symbol is used. It has 4 different modes:
1.Price Scatter: Plots the prices from each exchange around one center white line that represents the mean price across all 6 exchanges.
2. Price Line: Same thing as above, except lines are used instead of circles.
3. Volume Scatter: Plots the volumes for each exchange as colored circles, similar to a scatter plot.
4. Volume Line: Same as above except lines are used instead of circles.
The label in the top right corner displays the current price for each exchange. This can be configured in the input menu and can display
-Current Price
-% Difference from Mean
-$ Difference from Mean
This label also displays the highest and lowest price (or % diff) amongst the 6 exchanges.
Prices are pulled in 1 minute intervals, but the mean price line(white) can be adjusted to show 5, 15, 30, 1 hour or 2 hour avg price across all 6 exchanges.
Script protégé
Ce script est publié en source fermée. Cependant, vous pouvez l'utiliser librement et sans aucune restriction – pour en savoir plus, cliquez ici.
-Profit Programmers
profitprogrammer.com
profitprogrammer.com
Clause de non-responsabilité
Les informations et publications ne sont pas destinées à être, et ne constituent pas, des conseils ou recommandations financiers, d'investissement, de trading ou autres fournis ou approuvés par TradingView. Pour en savoir plus, consultez les Conditions d'utilisation.