OPEN-SOURCE SCRIPT
Vrext- Advanced EMA Zone
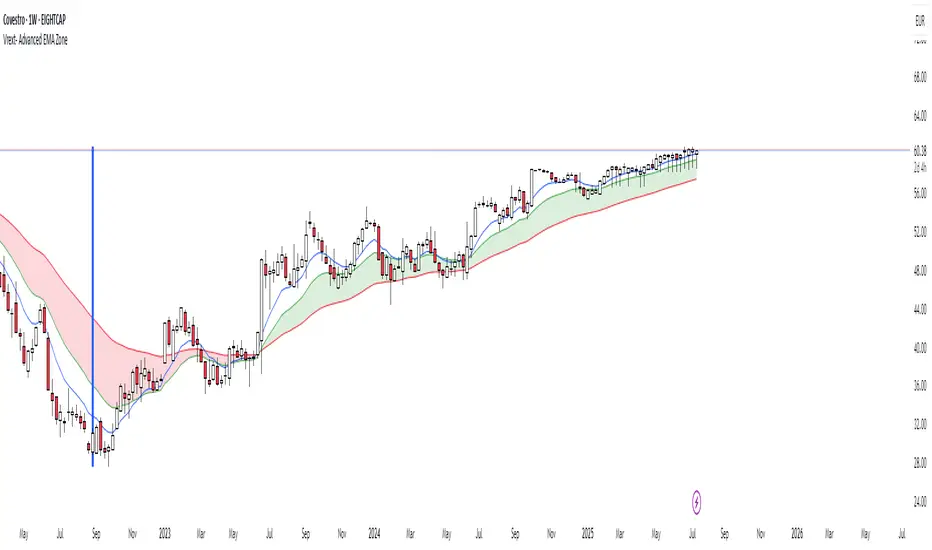
The indicator highlights an area between two manually adjustable EMA-s to visibly mark a zone. A zone where the larger EMA is bellow the smaller one (indicating an uptrend) is marked green. On the opposite hand where higher EMA is above the lower the zone (indicating a downtrend) is marked red.
For correct zone marking enter EMA-s in descending order.
The indicator also allows you to add further additional EMA-s, which do not have a zone drawn between them and are just stand alone EMA-s. They are fully customisable in terms of colour, width. etc.
Additionally the indicator allows you to plot a vertical line ''xyz'' candles in the past. The idea behind it is that if you want to only focus on the previous 150 candles, there will be a clear line at the 150th candle for easier navigating.
Script open-source
Dans l'esprit TradingView, le créateur de ce script l'a rendu open source afin que les traders puissent examiner et vérifier ses fonctionnalités. Bravo à l'auteur! Bien que vous puissiez l'utiliser gratuitement, n'oubliez pas que la republication du code est soumise à nos Règles.
Clause de non-responsabilité
Les informations et publications ne sont pas destinées à être, et ne constituent pas, des conseils ou recommandations financiers, d'investissement, de trading ou autres fournis ou approuvés par TradingView. Pour en savoir plus, consultez les Conditions d'utilisation.