PROTECTED SOURCE SCRIPT
Dios51 TrendMatrix
🟢 Dios51 TrendMatrix – User Manual
Purpose:
Identify early trend breakouts with EMA High/Low channels, EMA200 trend filter, and RSI momentum confirmation.
📊 Components Overview
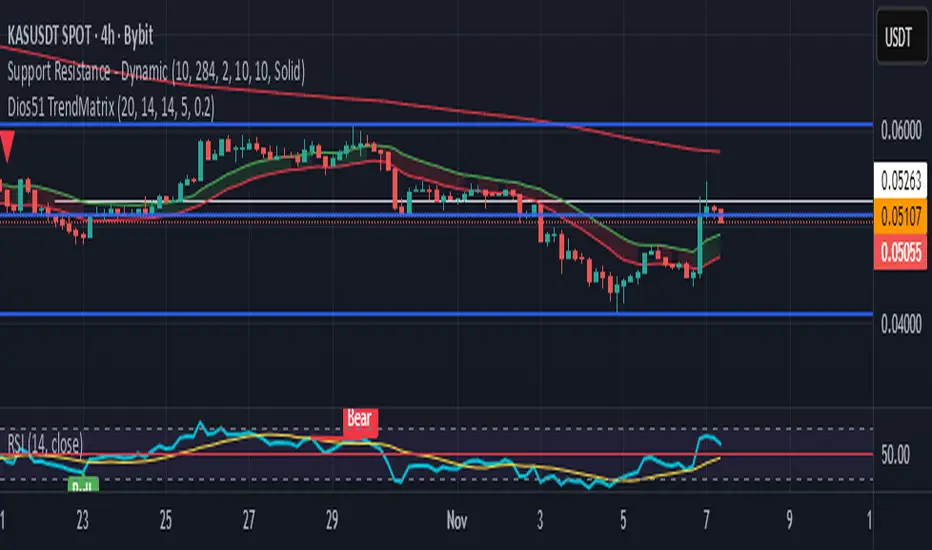
EMA High / EMA Low (Green & Red lines) – Define a dynamic price channel for breakout detection.
EMA200 (Yellow = Bullish, Red = Bearish) – Shows overall trend direction. Trade primarily in the EMA200 trend direction.
RSI + MA – Confirms momentum; crossover above MA signals bullish momentum, below MA signals bearish.
Background Fill – Green = bullish, Red = bearish. Visual aid for trend alignment.
Signal Arrows –
🔼 Green = Long breakout signal
🔽 Red = Short breakout signal
✅ Long Signal (Buy) Criteria
Candle closes above EMA High
RSI crosses above its MA
Candle is bullish (close > open)
Candle meets ATR filter (strong breakout)
EMA200 is Yellow (Bullish)
Cooldown period between signals is satisfied
❌ Short Signal (Sell) Criteria
Candle closes below EMA Low
RSI crosses below its MA
Candle is bearish (close < open)
Candle meets ATR filter (strong breakout)
EMA200 is Red (Bearish)
Cooldown period between signals is satisfied
🎯 Trade Management
Entry:
Next candle after the arrow appears
Confirm EMA200 trend aligns with the signal direction
Stop-loss:
For Long → below EMA Low
For Short → above EMA High
Exit:
Price re-enters EMA channel
Trend weakens (EMA200 changes color)
⚙️ Tips for Best Performance
Ideal on 15m–4h charts
Avoid sideways/consolidation markets
Trade only in direction of EMA200 color for higher probability
Combine with volume or higher timeframe EMA for additional confirmation
📌 Panel Legend (if using on-chart panel)
EMA200: Yellow = Bullish, Red = Bearish
Last Signal: Long / Short / None
RSI Status: Above MA = bullish, Below MA = bearish
Purpose:
Identify early trend breakouts with EMA High/Low channels, EMA200 trend filter, and RSI momentum confirmation.
📊 Components Overview
EMA High / EMA Low (Green & Red lines) – Define a dynamic price channel for breakout detection.
EMA200 (Yellow = Bullish, Red = Bearish) – Shows overall trend direction. Trade primarily in the EMA200 trend direction.
RSI + MA – Confirms momentum; crossover above MA signals bullish momentum, below MA signals bearish.
Background Fill – Green = bullish, Red = bearish. Visual aid for trend alignment.
Signal Arrows –
🔼 Green = Long breakout signal
🔽 Red = Short breakout signal
✅ Long Signal (Buy) Criteria
Candle closes above EMA High
RSI crosses above its MA
Candle is bullish (close > open)
Candle meets ATR filter (strong breakout)
EMA200 is Yellow (Bullish)
Cooldown period between signals is satisfied
❌ Short Signal (Sell) Criteria
Candle closes below EMA Low
RSI crosses below its MA
Candle is bearish (close < open)
Candle meets ATR filter (strong breakout)
EMA200 is Red (Bearish)
Cooldown period between signals is satisfied
🎯 Trade Management
Entry:
Next candle after the arrow appears
Confirm EMA200 trend aligns with the signal direction
Stop-loss:
For Long → below EMA Low
For Short → above EMA High
Exit:
Price re-enters EMA channel
Trend weakens (EMA200 changes color)
⚙️ Tips for Best Performance
Ideal on 15m–4h charts
Avoid sideways/consolidation markets
Trade only in direction of EMA200 color for higher probability
Combine with volume or higher timeframe EMA for additional confirmation
📌 Panel Legend (if using on-chart panel)
EMA200: Yellow = Bullish, Red = Bearish
Last Signal: Long / Short / None
RSI Status: Above MA = bullish, Below MA = bearish
Script protégé
Ce script est publié en source fermée. Cependant, vous pouvez l'utiliser librement et sans aucune restriction – pour en savoir plus, cliquez ici.
Clause de non-responsabilité
Les informations et publications ne sont pas destinées à être, et ne constituent pas, des conseils ou recommandations financiers, d'investissement, de trading ou autres fournis ou approuvés par TradingView. Pour en savoir plus, consultez les Conditions d'utilisation.