OPEN-SOURCE SCRIPT
Pipe tops & bottoms v1.0

This indicator detects Pipe Tops and Pipe Bottoms chart patterns, using the concept described by Thomas Bulkowski: Tops, Bottoms.
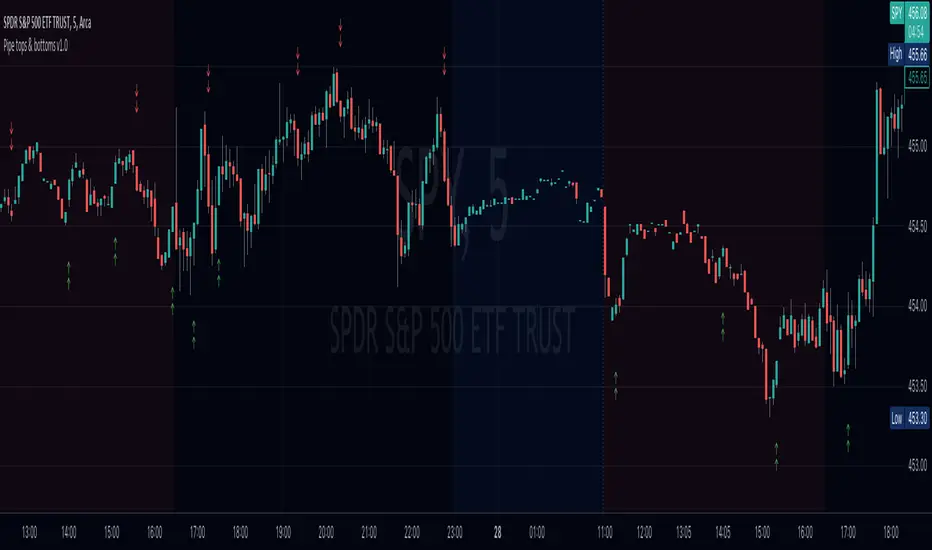
Pipe tops and bottoms patterns are marked on the chart. You can change the indicator sensitivity by using the main settings which define detected price variation boundaries. This will lead to more dense or sparse pattern detection.
Once the bar following each detected top or bottom pattern satisfies signal condition (the current close price must be higher than the high of the pipe bottom, or lower than the low of the pipe top), these bars are also marked on the chart and can be used to define potential long or short entry points.
You can optionally choose to show only signal marks on the chart (this is preferable to avoid visual cluttering), or both pattern and signal marks.
Script calculations are based on the 'Pipe Bottoms Indicator Based on Thomas Bulkowski's Theories' indicator developed by BoilderRoomColdCaller in 2020.
Script open-source
Dans l'esprit TradingView, le créateur de ce script l'a rendu open source afin que les traders puissent examiner et vérifier ses fonctionnalités. Bravo à l'auteur! Bien que vous puissiez l'utiliser gratuitement, n'oubliez pas que la republication du code est soumise à nos Règles.
Clause de non-responsabilité
Les informations et publications ne sont pas destinées à être, et ne constituent pas, des conseils ou recommandations financiers, d'investissement, de trading ou autres fournis ou approuvés par TradingView. Pour en savoir plus, consultez les Conditions d'utilisation.