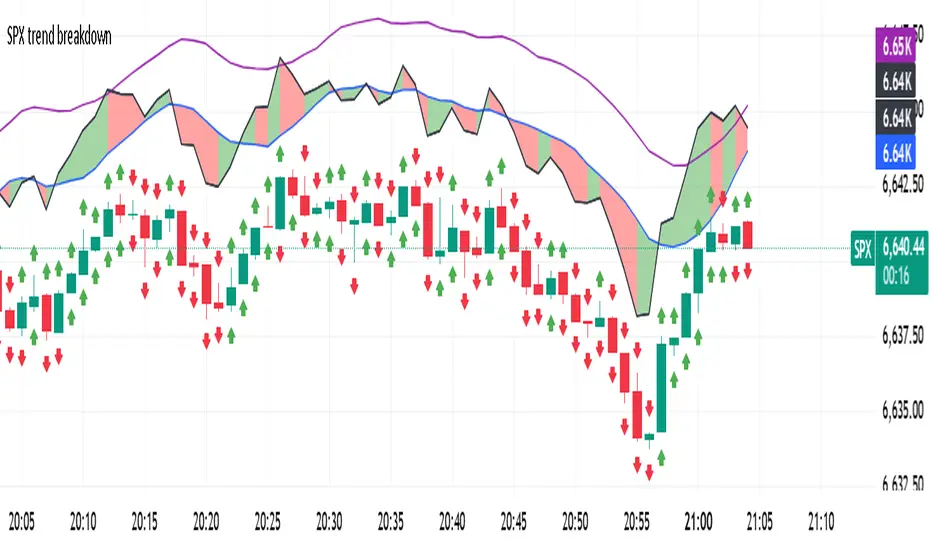
SPX trend breakdown
Please note that currently this indicator works only on ( spx s&p 500 index cfd sp )
explanation:
1- The purple line (candle high) is estimating the trend movement for short term.
2- The blue line (candle average) is moving average based on the candle highest close.
3- The black line (variable) is the actual movement of the trend.
- If black line above blue line with green background color, the candle is green and moving up.
- If black line above blue line with red background color, the candle is red but still above blue line.
- If the black line below blue line with red background color, the candle is red and moving down.
- If the black line below the blue line with green background color, the candle is green but still below blue line.
4- The green arrow up symbol above candle indicates that the top of current candle is higher than previous candle.
5- The green arrow up symbol below candle indicates that the bottom of current candle is higher than previous candle.
6- The red arrow down symbol above candle indicates that the top of current candle is lower than previous candle.
7- The red arrow down symbol below candle indicates that the bottom of current candle is lower than previous candle.
Script sur invitation seulement
Seuls les utilisateurs approuvés par l'auteur peuvent accéder à ce script. Vous devrez demander et obtenir l'autorisation pour l'utiliser. Celle-ci est généralement accordée après paiement. Pour plus de détails, suivez les instructions de l'auteur ci-dessous ou contactez directement Ahmed1Al.
TradingView ne recommande PAS de payer ou d'utiliser un script à moins que vous ne fassiez entièrement confiance à son auteur et que vous compreniez comment il fonctionne. Vous pouvez également trouver des alternatives gratuites et open-source dans nos scripts communautaires.
Instructions de l'auteur
Clause de non-responsabilité
Script sur invitation seulement
Seuls les utilisateurs approuvés par l'auteur peuvent accéder à ce script. Vous devrez demander et obtenir l'autorisation pour l'utiliser. Celle-ci est généralement accordée après paiement. Pour plus de détails, suivez les instructions de l'auteur ci-dessous ou contactez directement Ahmed1Al.
TradingView ne recommande PAS de payer ou d'utiliser un script à moins que vous ne fassiez entièrement confiance à son auteur et que vous compreniez comment il fonctionne. Vous pouvez également trouver des alternatives gratuites et open-source dans nos scripts communautaires.