OPEN-SOURCE SCRIPT
Bitcoin MVRV Z-Score Indicator
### **What This Script Does (In Plain English)**
Imagine Bitcoin has a "fair price" based on what people *actually paid* for it (called the **Realized Value**). This script tells you if Bitcoin is currently **overpriced** or **underpriced** compared to that fair price, using math.
---
### **How It Works (Like a Car Dashboard)**
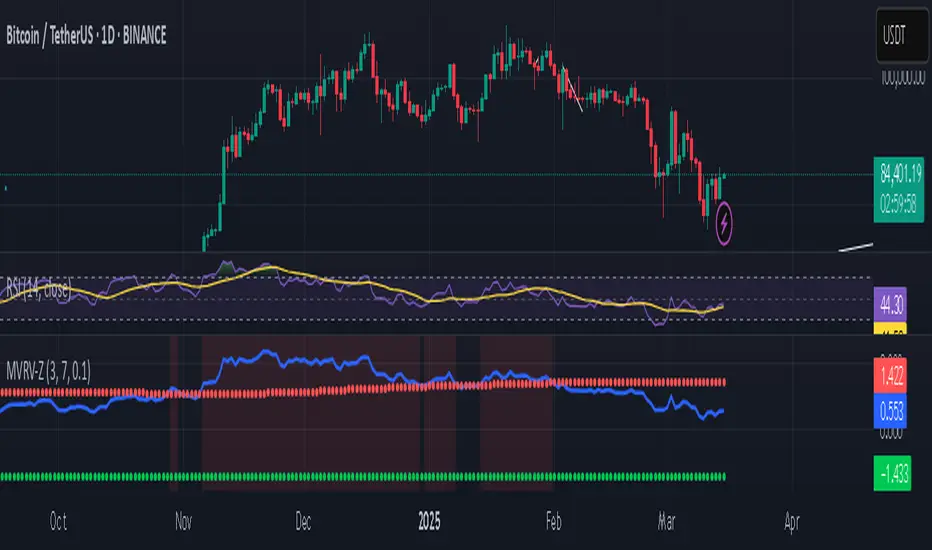
1. **The Speedometer (Z-Score Line)**
- The blue line (**Z-Score**) acts like a speedometer for Bitcoin’s price:
- **Above Red Line** → Bitcoin is "speeding" (overpriced).
- **Below Green Line** → Bitcoin is "parked" (underpriced).
2. **The Warning Lights (Colors)**
- **Red Background**: "Slow down!" – Bitcoin might be too expensive.
- **Green Background**: "Time to fuel up!" – Bitcoin might be a bargain.
3. **The Alarms (Alerts)**
- Your phone buzzes when:
- Green light turns on → "Buy opportunity!"
- Red light turns on → "Be careful – might be time to sell!"
---
### **Real-Life Example**
- **2021 Bitcoin Crash**:
- The red light turned on when Bitcoin hit $60,000+ (Z-Score >7).
- A few months later, Bitcoin crashed to $30,000.
- **2023 Rally**:
- The green light turned on when Bitcoin was around $20,000 (Z-Score <0.1).
- Bitcoin later rallied to $35,000.
---
### **How to Use It (3 Simple Steps)**
1. **Look at the Blue Line**:
- If it’s **rising toward the red zone**, Bitcoin is getting expensive.
- If it’s **falling toward the green zone**, Bitcoin is getting cheap.
2. **Check the Colors**:
- Trade carefully when the background is **red**.
- Look for buying chances when it’s **green**.
3. **Set Alerts**:
- Get notified when Bitcoin enters "cheap" or "expensive" zones.
---
### **Important Notes**
- **Not Magic**: This tool helps spot trends but isn’t perfect. Always combine it with other indicators.
- **Best for Bitcoin**: Works great for Bitcoin, not as well for altcoins.
- **Long-Term Focus**: Signals work best over months/years, not hours.
---
Think of it as a **thermometer for Bitcoin’s price fever** – it tells you when the market is "hot" or "cold." 🔥❄️
Imagine Bitcoin has a "fair price" based on what people *actually paid* for it (called the **Realized Value**). This script tells you if Bitcoin is currently **overpriced** or **underpriced** compared to that fair price, using math.
---
### **How It Works (Like a Car Dashboard)**
1. **The Speedometer (Z-Score Line)**
- The blue line (**Z-Score**) acts like a speedometer for Bitcoin’s price:
- **Above Red Line** → Bitcoin is "speeding" (overpriced).
- **Below Green Line** → Bitcoin is "parked" (underpriced).
2. **The Warning Lights (Colors)**
- **Red Background**: "Slow down!" – Bitcoin might be too expensive.
- **Green Background**: "Time to fuel up!" – Bitcoin might be a bargain.
3. **The Alarms (Alerts)**
- Your phone buzzes when:
- Green light turns on → "Buy opportunity!"
- Red light turns on → "Be careful – might be time to sell!"
---
### **Real-Life Example**
- **2021 Bitcoin Crash**:
- The red light turned on when Bitcoin hit $60,000+ (Z-Score >7).
- A few months later, Bitcoin crashed to $30,000.
- **2023 Rally**:
- The green light turned on when Bitcoin was around $20,000 (Z-Score <0.1).
- Bitcoin later rallied to $35,000.
---
### **How to Use It (3 Simple Steps)**
1. **Look at the Blue Line**:
- If it’s **rising toward the red zone**, Bitcoin is getting expensive.
- If it’s **falling toward the green zone**, Bitcoin is getting cheap.
2. **Check the Colors**:
- Trade carefully when the background is **red**.
- Look for buying chances when it’s **green**.
3. **Set Alerts**:
- Get notified when Bitcoin enters "cheap" or "expensive" zones.
---
### **Important Notes**
- **Not Magic**: This tool helps spot trends but isn’t perfect. Always combine it with other indicators.
- **Best for Bitcoin**: Works great for Bitcoin, not as well for altcoins.
- **Long-Term Focus**: Signals work best over months/years, not hours.
---
Think of it as a **thermometer for Bitcoin’s price fever** – it tells you when the market is "hot" or "cold." 🔥❄️
Script open-source
Dans l'esprit TradingView, le créateur de ce script l'a rendu open source afin que les traders puissent examiner et vérifier ses fonctionnalités. Bravo à l'auteur! Bien que vous puissiez l'utiliser gratuitement, n'oubliez pas que la republication du code est soumise à nos Règles.
Clause de non-responsabilité
Les informations et publications ne sont pas destinées à être, et ne constituent pas, des conseils ou recommandations financiers, d'investissement, de trading ou autres fournis ou approuvés par TradingView. Pour en savoir plus, consultez les Conditions d'utilisation.