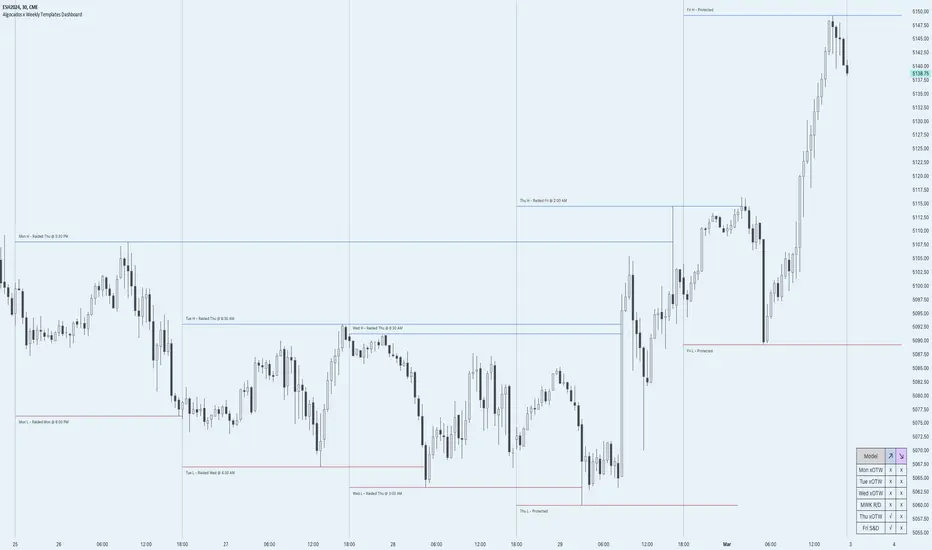
ICT Weekly Profile Templates Dashboard by AlgoCados

# Key Features
Weekly Templates Dashboard: An advanced feature supported by an easy-to-understand table that lists all 12 profiles, simplifying the process of identifying current market scenarios and potential future movements.
Intraweek POI: Identifies key intraweek levels of interest (Daily Highs / Daily Lows) with configurable visual styles. Distinguish between buyside and sellside POIs with solid, dotted, or dashed lines in colors that stand out or blend in, according to your preference.
POI Raids Insights: Automatically updates the lines and label of a key level once it gets broken, highlighting the time when the high or low was taken out,.to provide a comprehensive overview of weekly market dynamics.
Customization at its Core: With inputs for line styles, colors, and even font specifications for text and labels, the dashboard is fully customizable to fit your charting needs. Whether you prefer solid lines for emphasis or dotted lines for a more subdued look, the choice is yours.
Utility and Style: The script doesn't just offer functional benefits; it also considers aesthetics. Choose from Monospace or Sans Serif fonts and adjust the size to ensure that your dashboard is not only informative but also visually pleasing.
# ICT Weekly Pattern
"xOTW" serves as placeholder for "LOTW" (Low of the Week) and "HOTW" (High of the Week). This visual shorthand allows traders to quickly interpret market conditions, with a combination of "xOTW" alongside directional arrows "↗" (Bullish) and "↘" (Bearish).
Bullish Patterns Analyzed
- Mon LOTW: Monday Low Of The Week / Classic Buy Week;
- Tue LOTW: Tuesday Low Of The Week / Classic Buy Week;
- Wed LOTW: Wednesday Low of the Week;
- MWK R: Consolidation Midweek Rally;
- Thu LOTW: Thursday Low Of The Week / Consolidation Thursday Reversal (Bullish);
- Fri S&D: Seek and Destroy Bullish Friday;
Bearish Patterns Analyzed
- Mon HOTW: Monday High Of The Week / Classic Sell Week;
- Tue HOTW: Tuesday High Of The Week / Classic Sell Week;
- Wed HOTW: Wednesday High of the Week;
- MWK D: Consolidation Midweek Decline;
- Thu HOTW: Thursday High Of The Week / Consolidation Thursday Reversal (Bearish);
- Fri S&D: Seek and Destroy Bearish Friday;
# Inputs
- Offset: Adjusts the offset for the daily open marker, allowing users to shift the position of the session start visual cue on the chart.
- Show Historic Data: Toggles the display of historical session data, enabling traders to either keep a continuous record of sessions throughout the chart or reset data at the start of each new week.
- Show Session Start: Activates vertical dividers at the start of each trading session, providing a clear demarcation of session boundaries.
- Show Session Open: Displays the opening price for each session, offering immediate visual cues to the session's starting strength or weakness.
- Extend Session Open: Extends the session's opening price line to the current bar, giving a persistent reference point throughout the trading session.
Intraweek POI Styles and Colors
- Start Line Style: Customizes the style of session start lines with options for solid, dotted, or dashed appearances.
- Start Line Color: Chooses the color for session start lines, enhancing chart readability.
- Daily Open Style and Color: Sets the style and color for the daily open lines, distinguishing them from other chart elements.
- Buyside Line Style and Color: Adjusts the visualization of potential buyside areas of interest with customizable line styles and colors.
- Sellside Line Style and Color: Configures the display for potential sellside points of interest, allowing for distinct visual differentiation.
Utils for Aesthetics and Clarity
- Font Family and Size: Selects the font family and size for text elements within the indicator, ensuring clarity and consistency with your chart's aesthetic.
- Text and Background Colors: Defines the color for text and background elements, facilitating a harmonious integration with the chart's overall color scheme.
Embrace the essence of smarter trading where every insight is "Healthy For Your Trading."
# Bug Fixes
• Dashboard Visibility: The Dashboard will now only appear on Intraday Timeframes to enhance clarity
# Bug Fixes
• Thu xOTW: Minor Bug resolved within the Thu xOTW Logic
• Fri S&D: Minor Bug resolved within the Fri S&D Logic
- Forex Dividers from 5.00 PM ET: Users can now adjust the Sessions opening time for Forex Markets to be aligned with the daily bar opening time at 5 PM ET. Default Time for Session Dividers remains 6 PM ET.
# New Features
• Midnight Session: Added support for starting the weekly session from Midnight (00:00 NY Time) across all asset classes
# Improvements
• Session Logic: Session start times now reflect correct differentiation — 5:00 PM NY Time for Forex, 6:00 PM for Futures under "Standard" setting
• Label Cleanup: Removed background color from session labels for a cleaner chart display
• Pine Update: Upgraded script to Pine Script™ version 6 for improved compatibility and performance
Script sur invitation seulement
Seuls les utilisateurs approuvés par l'auteur peuvent accéder à ce script. Vous devrez demander et obtenir l'autorisation pour l'utiliser. Celle-ci est généralement accordée après paiement. Pour plus de détails, suivez les instructions de l'auteur ci-dessous ou contactez directement AlgoCados.
TradingView ne recommande PAS d'acheter ou d'utiliser un script à moins que vous ne fassiez entièrement confiance à son auteur et que vous compreniez son fonctionnement. Vous pouvez également trouver des alternatives gratuites et open source dans nos scripts communautaires.
Instructions de l'auteur
Clause de non-responsabilité
Script sur invitation seulement
Seuls les utilisateurs approuvés par l'auteur peuvent accéder à ce script. Vous devrez demander et obtenir l'autorisation pour l'utiliser. Celle-ci est généralement accordée après paiement. Pour plus de détails, suivez les instructions de l'auteur ci-dessous ou contactez directement AlgoCados.
TradingView ne recommande PAS d'acheter ou d'utiliser un script à moins que vous ne fassiez entièrement confiance à son auteur et que vous compreniez son fonctionnement. Vous pouvez également trouver des alternatives gratuites et open source dans nos scripts communautaires.