PROTECTED SOURCE SCRIPT
Mis à jour Momentum Index
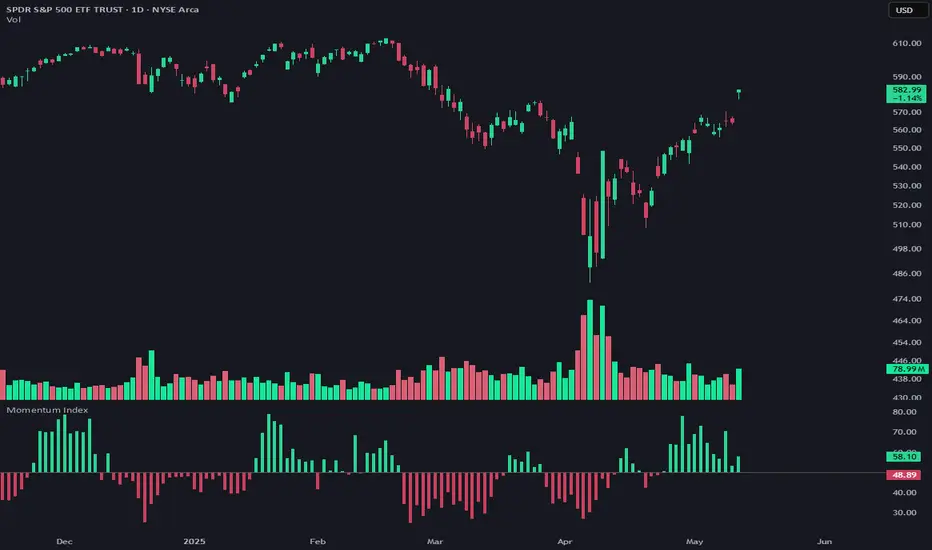
Momentum Index - Advanced Market Momentum Detector
This indicator combines two specialized oscillators to detect market momentum shifts with high precision. Unlike standard momentum indicators, it integrates both short-term volatility analysis and longer-term trend strength to provide a comprehensive view of market dynamics.
How It Works
The Momentum Index measures directional power through a dual-oscillator system:
A short-term volatility oscillator compares upward movement power (high minus previous low) against downward movement power (low minus previous high), normalized by ATR to ensure volatility independence.
A longer-term trend oscillator uses logarithmic price relationships to detect underlying trend strength through two complementary methods.
These oscillators are normalized, averaged, and enhanced with a momentum acceleration component for increased sensitivity to directional changes.
Trading Signals
The critical signal occurs when the indicator crosses the 50 line:
Crossing ABOVE 50: Bullish momentum is now dominant (green histogram)
Crossing BELOW 50: Bearish momentum is taking control (red histogram)
These crossings often precede significant price movements, making them valuable for both trend confirmation and early reversal detection.
Customization Options
Length: Adjusts the short-term oscillator sensitivity (default: 6)
Smoothing: Enables Ehlers smoothing to reduce noise
Smoothing Period: Controls the smoothing intensity
Display Options: Show as histogram or line
For optimal results, use on any timeframe from 15-minute to daily charts across all major markets. The indicator works particularly well for identifying momentum shifts at key support/resistance levels.
Notes de version
Bug FixNotes de version
Length no longer limited to 100Script protégé
Ce script est publié en source fermée. Cependant, vous pouvez l'utiliser librement et sans aucune restriction – pour en savoir plus, cliquez ici.
Clause de non-responsabilité
Les informations et publications ne sont pas destinées à être, et ne constituent pas, des conseils ou recommandations financiers, d'investissement, de trading ou autres fournis ou approuvés par TradingView. Pour en savoir plus, consultez les Conditions d'utilisation.
Script protégé
Ce script est publié en source fermée. Cependant, vous pouvez l'utiliser librement et sans aucune restriction – pour en savoir plus, cliquez ici.
Clause de non-responsabilité
Les informations et publications ne sont pas destinées à être, et ne constituent pas, des conseils ou recommandations financiers, d'investissement, de trading ou autres fournis ou approuvés par TradingView. Pour en savoir plus, consultez les Conditions d'utilisation.