OPEN-SOURCE SCRIPT
PI indicator
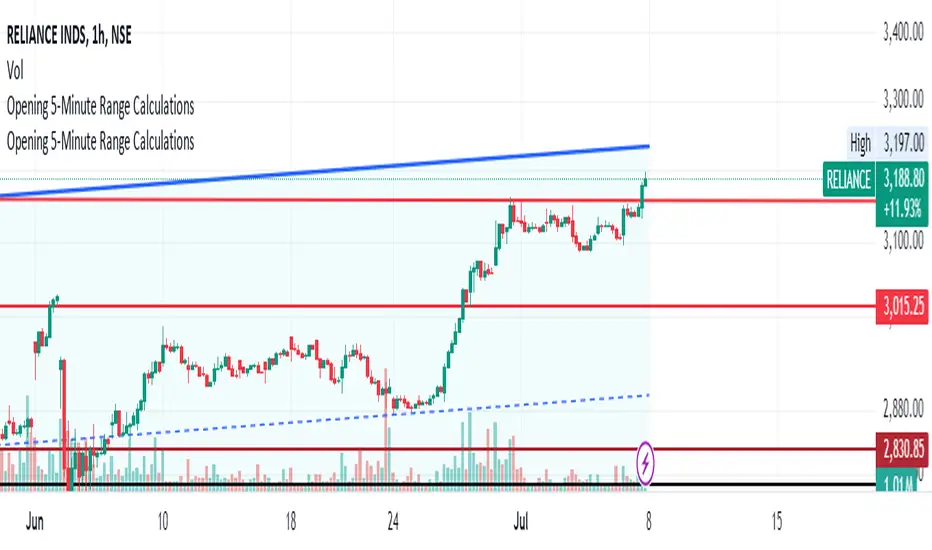
Opening 5-Minute Range Candle (A):
This represents the price range during the first 5 minutes of the trading day.
You can plot this as a vertical line connecting the high and low of the 5-minute candle.
Additionally, you can display the range values (high and low) as labels or in a table.
Multiply Opening Range Candle (A) with π (PI) Value (B):
Calculate the product of the opening range candle (A) and the value of π (approximately 3.14).
Plot this value as a line on the chart.
Optionally, you can label this line with the calculated value.
Divide B by 2 ©:
Divide the value obtained in step 2 (B) by 2.
Plot this value as another line on the chart.
You can also label this line with the calculated value.
Add C to A (D):
Sum the value of C (from step 3) with the opening range candle (A).
Plot this sum as a line on the chart.
Label this line accordingly.
Add C to D (E):
Add the value of C (from step 3) to the value of D (from step 4).
Plot this sum as another line on the chart.
Label it appropriately.
Add D to E (F):
Finally, add the value of D (from step 4) to the value of E (from step 5).
Plot this sum as a line with a distinct style (e.g., dashed or dotted) on the chart.
Label this line as well.
Remember that these steps involve mathematical calculations and plotting lines on the chart. You can customize the appearance (color, style, thickness) of each line and label according to your preferences. Additionally, consider adjusting the time frame to accurately capture the opening 5-minute range at 9:20:50 am.
Script open-source
Dans l'esprit TradingView, le créateur de ce script l'a rendu open source afin que les traders puissent examiner et vérifier ses fonctionnalités. Bravo à l'auteur! Bien que vous puissiez l'utiliser gratuitement, n'oubliez pas que la republication du code est soumise à nos Règles.
Clause de non-responsabilité
Les informations et publications ne sont pas destinées à être, et ne constituent pas, des conseils ou recommandations financiers, d'investissement, de trading ou autres fournis ou approuvés par TradingView. Pour en savoir plus, consultez les Conditions d'utilisation.