OPEN-SOURCE SCRIPT
ETH Top, Mid and Bottom Cap Bands [jcray]
Modified from Average Cap [aamonkey] and Top Cap [aamonkey].
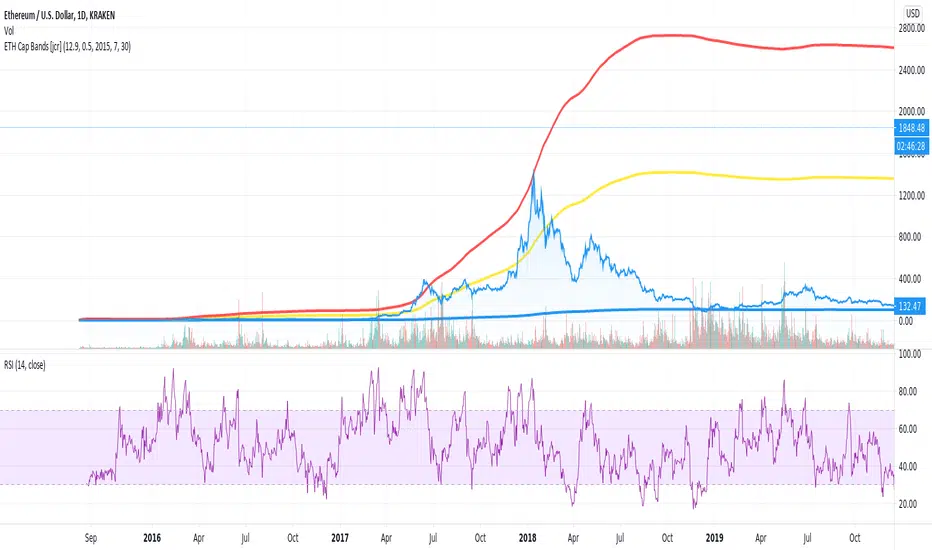
The top cap (red line) can be seen as an absolute market top that may never be significantly exceeded and so is a good indicator to sell a position, or enter a long-term short-sell.
The mid cap (yellow line) can be used as an indicator for market sentiment. Above the mid cap, the market is in a bullish environment, and below it, the market is in a bearish environment.
The bottom cap (blue line) can be seen as an absolute market bottom that may never be fallen short of, and so is a good indicator to enter a long-term buying opportunity, or exit a long-term short-sell.
Script open-source
Dans l'esprit TradingView, le créateur de ce script l'a rendu open source afin que les traders puissent examiner et vérifier ses fonctionnalités. Bravo à l'auteur! Bien que vous puissiez l'utiliser gratuitement, n'oubliez pas que la republication du code est soumise à nos Règles.
Clause de non-responsabilité
Les informations et publications ne sont pas destinées à être, et ne constituent pas, des conseils ou recommandations financiers, d'investissement, de trading ou autres fournis ou approuvés par TradingView. Pour en savoir plus, consultez les Conditions d'utilisation.