INVITE-ONLY SCRIPT
MTF TrendLines [Private]
Mis à jour
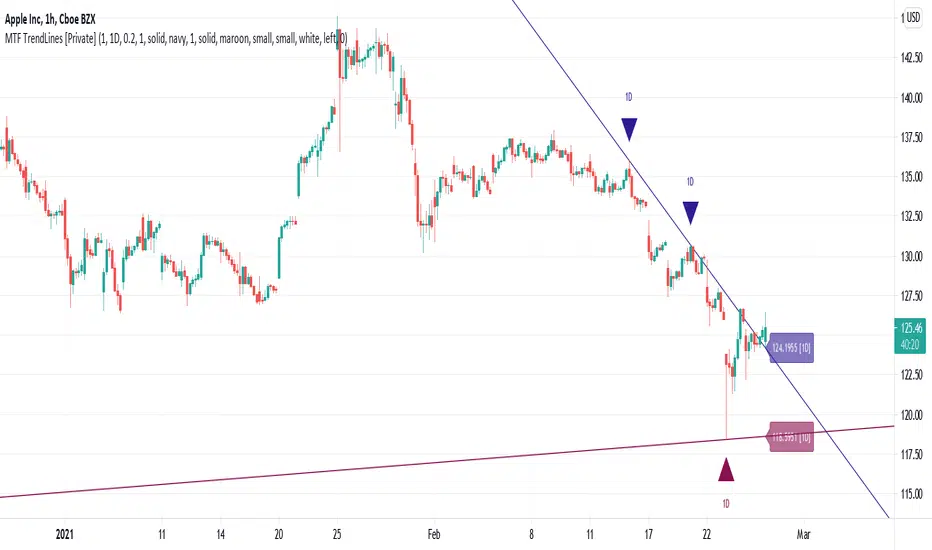
As the name suggests, the Multi-Timeframe (MTF) Trendlines indicator allows you to extrapolate trendlines from a higher timeframe into your chart timeframe. A maximum of one upper trendline and one lower trendline will be plotted per indicator instance. You can load multiple copies of the indicator into your chart and manually set each copy to operate in a different higher timeframe.
The trendlines are based on the two most recent upper and lower qualifying pivots found in the higher timeframe, and you can adjust the pivot size via the settings menu. In order to qualify, an upper trendline must have a flat to downward slope and a lower trendline must have a flat to upward slope. In both cases there should not be any breach of the trendline between the two pivots. A tolerance factor is provided so you can introduce some leeway in terms of what constitutes a breach.
As mentioned above, the trendlines are actually extrapolated into the chart timeframe. By that we mean that the cluster of bars that comprise each individual pivot in the higher timeframe are located in the chart timeframe, and the bar with the highest-high/lowest-low is used as the actual pivot point. This is necessary because, for example, the high of a daily pivot bar may not always exactly match the highest-high found in the pivot cluster in the chart timeframe.
In terms of selecting the higher timeframe, there are two modes of operation which can be selected via the settings dialog. In Auto Mode the indicator will automatically select the higher timeframe to use based on your chart timeframe. In Manual Mode you select the higher timeframe to use. In either case the selected higher timeframe must always be greater than or equal to the chart timeframe.
Along with each trendline you can also elect to plot pivot markers as well as price labels. Each can be customized and/or toggled on or off via the settings dialog.
The pivot markers will display as up or down triangle shapes plotted below (for lower trendline) or above (for upper trendline) the two price bars that represent the two pivots used in generating the trendline. You have the option to display just the marker, or display the marker plus the timeframe.
The price labels will display on the most current price bar (an offset is provided) and can be configured to display the trendline value as of that bar, the trendline timeframe, or both. You can also adjust the orientation of the price labels.
For the trendlines themselves, you can adjust the color, thickness, and line type. You can also toggle upper and lower trendlines on or off independently.
Please visit the link in our Signature for pricing.
Notes de version
Updates for memory restriction errors.Notes de version
Adjustments for series error.Notes de version
Updated to Pinescript V5Notes de version
Added trendline source as a new option. You can select between high/low (the default) and close. If close is selected then all trendlnes will be based off of the close price rather than the conventional high/low. This would make sense if you are plotting a close-line chart rather than a bar or candle chart.Script sur invitation seulement
L'accès à ce script est limité aux utilisateurs autorisés par l'auteur et nécessite généralement un paiement. Vous pouvez l'ajouter à vos favoris, mais vous ne pourrez l'utiliser qu'après avoir demandé et obtenu l'autorisation de son auteur. Contactez divergencesw pour plus d'informations, ou suivez les instructions de l'auteur ci-dessous.
TradingView ne suggère pas de payer pour un script et de l'utiliser à moins que vous ne fassiez confiance à 100% à son auteur et que vous compreniez comment le script fonctionne. Dans de nombreux cas, vous pouvez trouver une bonne alternative open-source gratuite dans nos Scripts communautaires.
Instructions de l'auteur
″For more information, please visit: https://www.sr-analyst.com/tradingview.php
Vous voulez utiliser ce script sur un graphique ?
Avertissement: veuillez lire avant de demander l'accès.
Divergence Software, Inc.
sr-analyst.com/tradingview.php
sr-analyst.com/tradingview.php
Clause de non-responsabilité
Les informations et les publications ne sont pas destinées à être, et ne constituent pas, des conseils ou des recommandations en matière de finance, d'investissement, de trading ou d'autres types de conseils fournis ou approuvés par TradingView. Pour en savoir plus, consultez les Conditions d'utilisation.