OPEN-SOURCE SCRIPT
Mis à jour Volume Balance Indicator Stealthy7

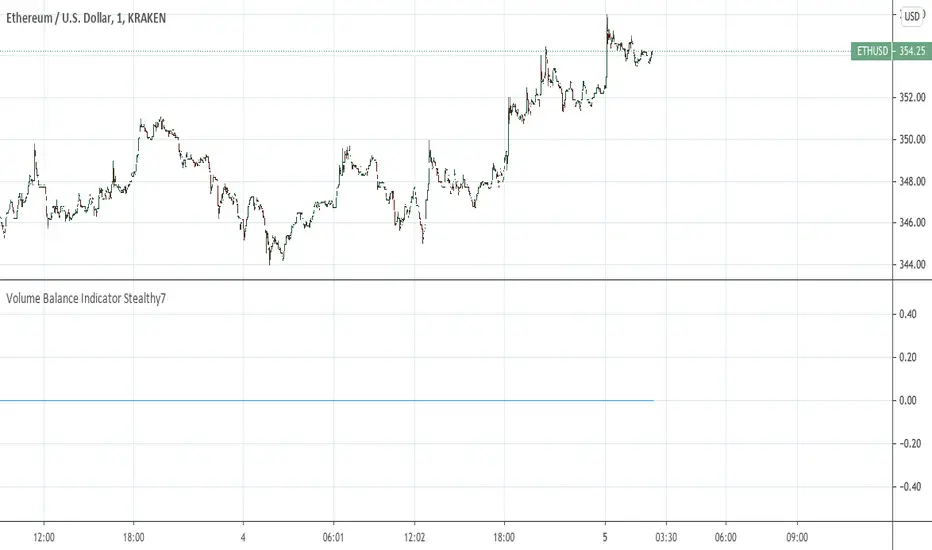
Find out if Bulls (buys) or Bears (sells) are moving the price. This gives a clear view of activity, even if you are using a higher time period. The lookback is in minutes, I believe. This is a superior volume indicator. Bars are recolored to show the underlying activity per the look back (minutes).
Notes de version
In this version I fixed the average volume (grey background). If volume eclipses the grey area, its above average by 30 periods.Notes de version
Automatic lookback.Bar re-color option.
Wow! Really shows whats going on.
Notes de version
I got rid of the old way displayed. This is much more useful and looks totally different.I added Standard deviation bands. Now you know if the volume is really on.
I used a hard coded lookback of 30 because its supposed to be significant (?)
Now you can really see a summary of the underlying minute to minute activity on higher bands.
Notes de version
I added a resolution dropdown box and a lookback period. I think this is closer to my original idea. You can view longer periods on a small timeframe. I think you can do vice versa like I originally intended. Not sure, but this is likely final update for this one. I realize now this is like an On Balance Volume indicator with some extras. I think this version is more useful.Notes de version
Changed some unnecessary code and default settings.Notes de version
Script depreciated. No support.Script open-source
Dans l'esprit TradingView, le créateur de ce script l'a rendu open source afin que les traders puissent examiner et vérifier ses fonctionnalités. Bravo à l'auteur! Bien que vous puissiez l'utiliser gratuitement, n'oubliez pas que la republication du code est soumise à nos Règles.
Clause de non-responsabilité
Les informations et publications ne sont pas destinées à être, et ne constituent pas, des conseils ou recommandations financiers, d'investissement, de trading ou autres fournis ou approuvés par TradingView. Pour en savoir plus, consultez les Conditions d'utilisation.
Script open-source
Dans l'esprit TradingView, le créateur de ce script l'a rendu open source afin que les traders puissent examiner et vérifier ses fonctionnalités. Bravo à l'auteur! Bien que vous puissiez l'utiliser gratuitement, n'oubliez pas que la republication du code est soumise à nos Règles.
Clause de non-responsabilité
Les informations et publications ne sont pas destinées à être, et ne constituent pas, des conseils ou recommandations financiers, d'investissement, de trading ou autres fournis ou approuvés par TradingView. Pour en savoir plus, consultez les Conditions d'utilisation.